DOGE price at the edge: will it finally break free or collapse back down?
Dogecoin sits at a crossroads with mixed signals flashing across the board.

By Pratik OswalChief Technical Analyst
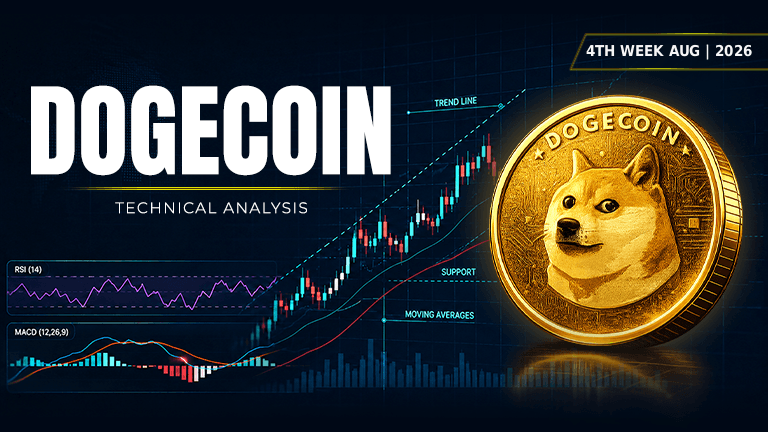
Asset | DOGE (DOGE/USDT) |
Price at Analysis | $0.08 |
Timeframe | Daily candle |
Date | August 31, 2026 |
Bias | NEUTRAL |
My Trade | Neutral: waiting for confirmation |
Cumulative Score | 5.7 / 10 |
200-day EMA | $0.09, price is below |
Bias Invalidation | Above $0.10 closes daily, or below $0.07 breaks support |
Overview
DOGE price is trading at $0.08 on the daily timeframe, sitting squarely in the middle of a defined range. The asset is trading $0.01 below its 200-day exponential moving average of $0.09, which historically acts as a macro-level barrier. The overall mood is neutral because the weight of technical evidence is split almost evenly between bullish and bearish factors, creating a tug-of-war dynamic that favors neither direction right now.
Across the ten major indicators, Dogecoin shows a fragmented narrative. Support levels are strong and well-stacked at $0.08 and $0.07, while resistance is incredibly dense at $0.09 with four layers of supply sitting right overhead. Volume is rising on the OBV indicator, which is encouraging, and a double bottom pattern is forming, both of which lean bullish. However, MACD is rolling over below its signal line, the trendline is below price at $0.09, and the Bollinger Bands are compressing, all of which suggest caution. Dogecoin price is essentially trapped between these competing forces, and the cumulative score of 5.7 out of 10 reflects this genuine indecision.
RSI: momentum is neutral, neither hot nor cold
The RSI reading of 54.6 sits right at the midpoint of neutral territory, just above the 50 line. This tells me momentum is balanced but tilted slightly toward the upside, with no signs of overbought or oversold extremes. A reading here is neither a strength nor a weakness; it simply reflects a market that is undecided about its next major move.
Score: 6 / 10 | Bullish
Moving Averages: short-term alignment, but long-term resistance overhead
The EMA 20, EMA 50, and EMA 100 are all stacked at $0.08, perfectly aligned with the current price, which is typically a bullish signal for short-term continuation. However, the EMA 200 sits at $0.09, one full cent above the current level, acting as a macro-level ceiling that Dogecoin has failed to break. This creates a two-part story: the short-term structure is constructive, but the longer-term trend is pointing slightly downward, making this a mixed picture overall.
Score: 7 / 10 | Bullish
Bollinger Bands: tight squeeze signals an imminent breakout
With the upper band at $0.10 and the lower band at $0.06, the bands are compressed around the midline at $0.08 where price currently sits. A tight Bollinger Band squeeze often precedes a sharp volatility expansion, and Dogecoin price appears ready for a directional move in the coming days. The narrow range suggests low volatility is storing energy, which typically results in a breakout either upward toward $0.10 or downward toward $0.06.
Score: 6 / 10 | Bullish
Fibonacci Retracements: price caught between key structural levels
With the swing high at $0.10 and the swing low at $0.07, price is currently sitting at the 0.236 and 0.382 retracement levels, both at $0.08. The 0.5 level sits at $0.09, which aligns perfectly with the 200-day EMA and the resistance zone. This clustering of Fibonacci levels at $0.09 suggests it is a major structural layer that price must overcome to move higher, but the concentration of levels here creates genuine difficulty for a sustained breakout.
Score: 5.5 / 10 | Neutral
Support Levels: multiple walls ready to catch a fall
Support is stacked at $0.08, $0.08, $0.07, and $0.07, creating a strong safety net directly beneath the current price. The fact that support is so close and well-defined means Dogecoin price has a tight stopping point if sellers take control. This structure is encouraging because it limits downside risk in the near term and provides a clear level for stop-loss placement.
Score: 7.5 / 10 | Bullish
Resistance: heavily congested overhead, only one target up
Resistance is stacked four times at $0.09, creating a formidable overhead barrier that is less than one cent away. This concentration of sell orders at a single level makes breakouts unlikely without significant volume, and it represents the first major test Dogecoin must pass. Above that, there is virtually no resistance until much higher price levels, but the density at $0.09 is a serious hurdle that has proven sticky in past attempts.
Score: 3 / 10 | Bearish
Trendline: price trades below the ascending line, a minor red flag
The ascending trendline sits at $0.09, and Dogecoin price is currently trading below it at $0.08, which is a mild bearish signal on the daily timeframe. An ascending trendline is drawn by connecting swing lows, and trading below it suggests the uptrend structure is weakening. However, the break is only marginal, and a quick return above the line would invalidate this bearish signal entirely.
Score: 4 / 10 | Bearish
MACD: histogram just turned negative, momentum may be fading
The MACD line at 0.003455 sits just below the signal line at 0.003733, and the histogram has turned negative at -0.000278. This crossover is a classic bearish signal, suggesting that momentum may be rolling over after a period of strength. It is early in this sell signal, but it is the kind of hidden divergence that often precedes a pullback or consolidation phase.
Score: 4 / 10 | Bearish
On-Balance Volume: accumulation is underway, buyers are active
The OBV trend is rising, which means that over recent candles, volume has been printing on up days more than down days. This is a bullish divergence signal and suggests that buyers are accumulating Dogecoin at these levels despite the sideways price action. Rising OBV often precedes a directional breakout, making this one of the most constructive signals on the chart.
Score: 7 / 10 | Bullish
Chart Patterns: double bottom hints at bullish reversal ahead
A double bottom pattern is forming on the daily chart, with two equal lows around the $0.07 level separated by a bounce higher. This classic reversal pattern suggests that sellers have exhausted their control at $0.07 and that buyers may be ready to push price higher. If confirmed with a daily close above $0.09, the double bottom would project a measured move target of approximately $0.11, which represents significant upside potential from the current level.
Score: 6.5 / 10 | Bullish
Indicator Scorecard
Indicator | Reading | Score / 10 |
|---|---|---|
RSI (14) | Neutral, above 50, balanced momentum | 6 |
EMAs (20 / 50 / 100 / 200) | Aligned short-term, 200 EMA above price | 7 |
Bollinger Bands | Compressed bands, ready for expansion | 6 |
Fibonacci | Price caught between key levels at $0.08-$0.09 | 5.5 |
Support | Strong and stacked at $0.08 and $0.07 | 7.5 |
Resistance | Dense overhead at $0.09, four-layer barrier | 3 |
Trendline | Price below ascending line at $0.09 | 4 |
MACD | Histogram turned negative, momentum rolling over | 4 |
On-Balance Volume | Rising OBV signals buyer accumulation | 7 |
Chart Patterns | Double bottom forming, bullish reversal signal | 6.5 |
Cumulative Average | NEUTRAL bias, waiting for directional confirmation | 5.7 |
My Trade: Going Neutral on DOGE price (sitting on the sidelines)
I'm taking a neutral stance on Dogecoin price right now because the cumulative score of 5.7 out of 10 reflects genuine indecision across the chart. The bullish signals like rising OBV, the double bottom pattern, and strong support at $0.08 are offset by bearish signals like MACD rolling over, resistance stacked at $0.09, and price trading below the ascending trendline. I'm not confident enough to initiate a directional bias in either direction, so I'm sitting on the sidelines and waiting for either a daily close above $0.10 or a break below $0.07 to give me a clear conviction signal. This is a consolidation period, and the smart move is to wait for the market to show its hand before I commit capital.
My entry zone | No entry at this time; waiting for confirmation |
My stop loss | N/A (neutral position) |
My target 1 | $0.10: Bollinger Band upper, resistance breakout |
My target 2 | $0.09: Trendline and 200-day EMA resistance |
My target 3 | $0.07: Support level and swing low |
Risk : Reward | N/A (no active position) |
Position | None: awaiting directional clarity |
When I Would Exit
I would flip my bias to bullish if Dogecoin closes above $0.10 on a daily candle with volume expansion, which would break both the Bollinger Band upper and confirm the double bottom pattern with authority. Conversely, I would consider a bearish scenario if DOGE price closes below $0.07 with conviction, which would break the structural support zone and invalidate the double bottom entirely. My thesis is neutral precisely because I don't yet have enough evidence to favor one outcome, so any daily close that clears either $0.10 or $0.07 would immediately change my mind and prompt me to take action.
Disclaimer: This article is produced for informational and educational purposes only and does not constitute financial or investment advice. Cryptocurrency markets are highly volatile and carry significant risk. Always conduct your own research and consult a qualified financial adviser before making any trading decisions.

Pratik Oswal
An Electronics and Telecommunication Engineer with a strong foundation in analytical and quantitative thinking. I have authored seven books on Mathematics and have been actively involved in trading since 2012. Since 2017, I have been deeply engaged in the crypto ecosystem, gaining extensive experience across digital assets, markets, and emerging blockchain technologies. My background combines technical expertise, mathematical proficiency, and over a decade of hands-on experience in financial markets.
More from PratikNext up

Grayscale Lets Investors Swap Crypto for Shares in 10 Funds
Grayscale now lets eligible investors trade tokens directly for shares in 10 crypto ETFs and trusts, with minimums from about $80,300 to $364,800.
 BTC
BTC ETH
ETH