Independent trading techniques called indicators were first developed by experienced traders. Candlesticks, volumes, and S&R are just a few examples of technical analysis tools that traders can use to support their technical analysis and make trading decisions.
Indicators are useful for buying, selling, verifying trends, and occasionally foretelling them. Leading and lagging indicators are the two types of indicators. A leading indicator anticipates the occurrence of a reversal or a new trend. While this seems interesting, keep in mind that not all leading signs are reliable.
A lagging indicator, on the other hand, follows the price, which means it typically announces a trend change or reversal after it has already happened. What good would receiving a signal after the incident, you might wonder. Well, better late than never, I suppose. The moving averages are one of the most widely used lagging indicators. Let’s take a look at the top three technical indicators that trading experts use the most frequently.
Relative Strength Index (RSI)
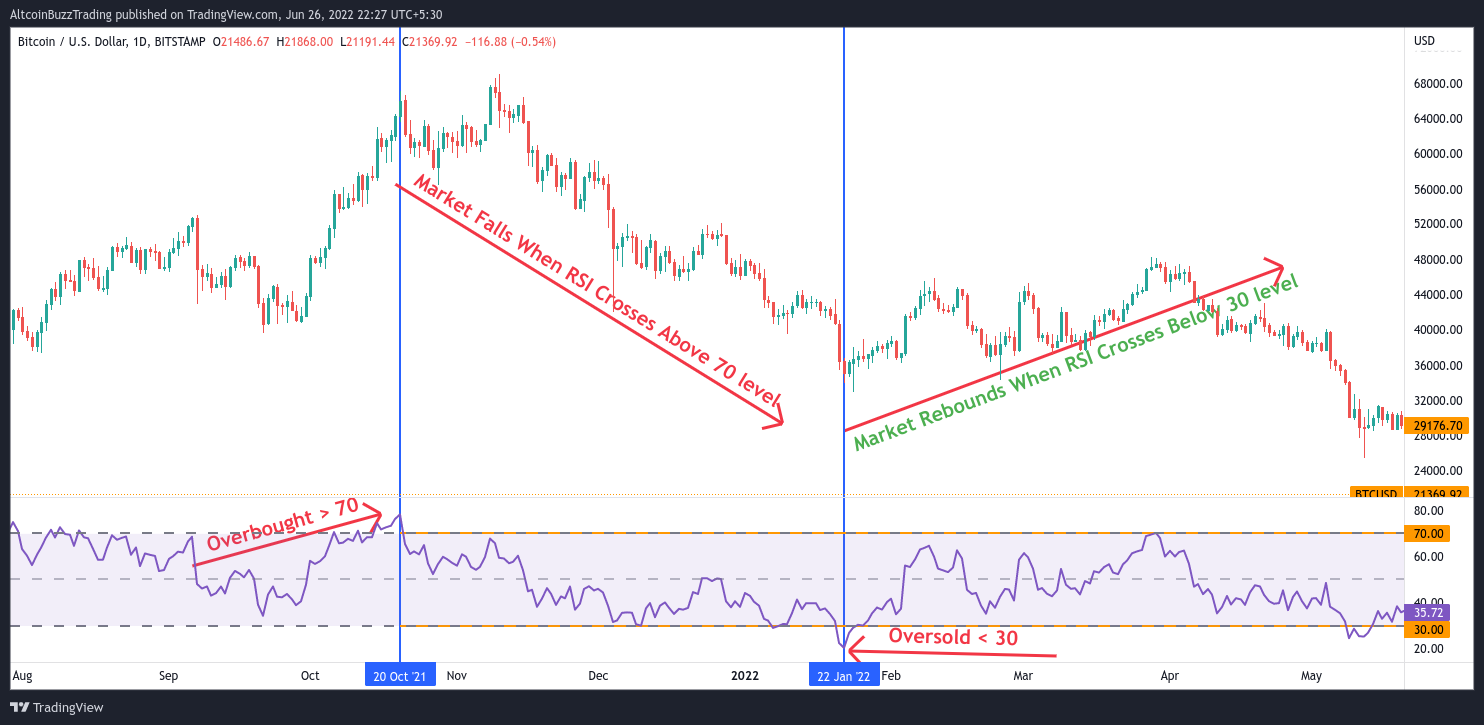
The Relative Strength Index is a momentum indicator with its own scale. The rate of change in price is known as momentum. A single line scaled from 0 to 100 identifies market overbought and oversold levels. Values greater than 70 suggest an overbought market, while readings less than 30 indicate an oversold market. It assists traders in determining when the price of a crypto asset is too far from its “true” value, allowing them to profit before the market corrects itself.
The Relative Strength Index is used by traders to discover ideal trading entry points, and it has shown to be a very helpful tool for trading the turbulent cryptocurrency markets over time. The whole point of RSI is to identify market tops and bottoms and enter a market while the trend is changing. This will enable you to benefit from the entire move. Check out the Bitcoin price graph below.
Take a look at the graphic above. The market was significantly overbought on October 22nd, 2021. This signals a strong sell. You would have exited at the peak of the BTC cycle if you had sold the market at this point and continued holding it until the RSI fell below 30 (around January 22 2022).
Bollinger Bands(BB)
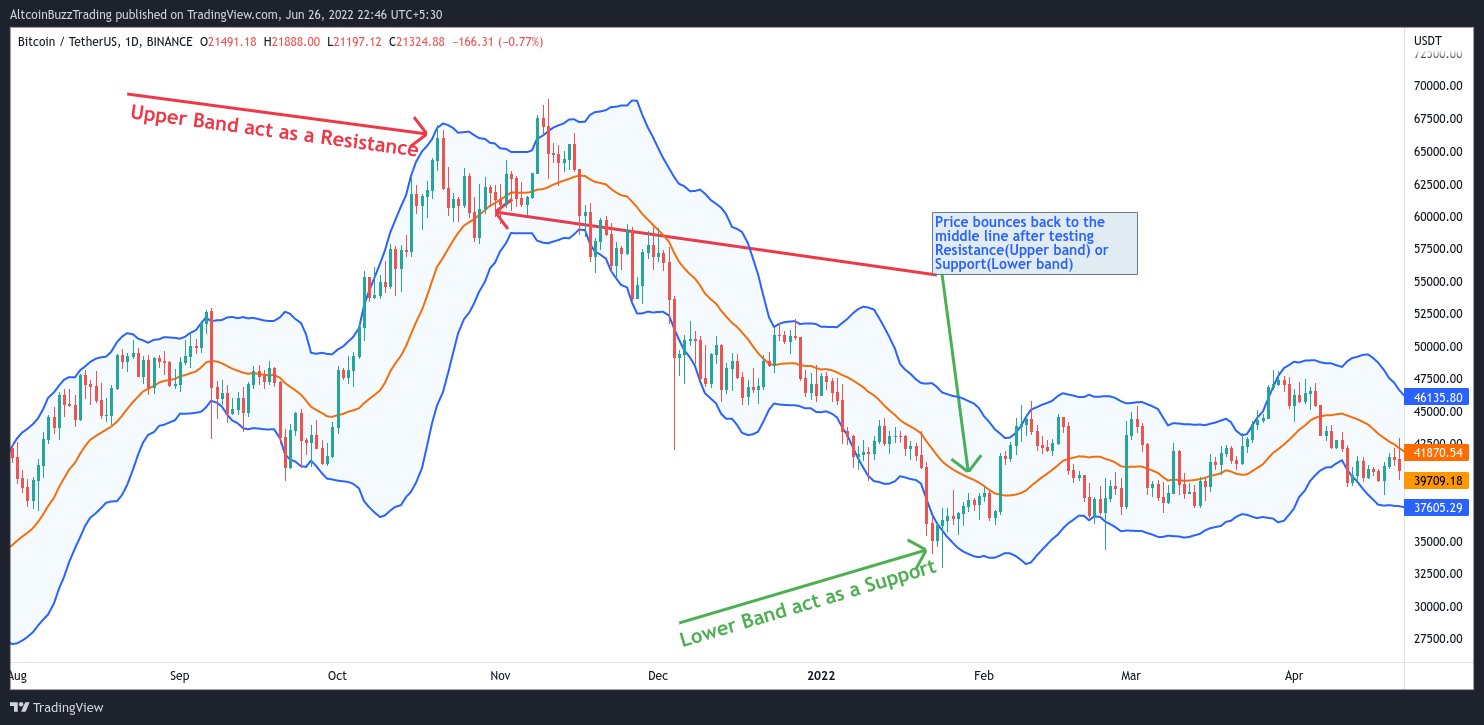
An indicator of volatility is the Bollinger band. They are made up of two lines plotted at 2 standard deviations on either side of the central moving average line, along with a simple moving average. The band is composed of its outer lines. The market is quiet when the band is narrow, to put it simply. When the market is active, it is loud.
Bollinger Bands are useful for trading in both range and trending markets. Watch out for the Bollinger Bounce in a range market. The price frequently swings back and forth between the two sides of the band, always circling back to the moving average. Similar to regression to the mean, this can be thought of. With time, the price will inevitably return to the average.
In essence, this handy little tool informs us whether the market is quiet or loud. The bands shrink when the market is quiet and enlarge when the market is noisy. Look at the Bitcoin price graph below. The Bollinger Bands (BB) indicator is a chart overlay, which means that it’s displayed over the price.
Both range and trending markets can be traded using Bollinger Bands. Watch out for the Bollinger Bounce in a market that is ranging. The moving average is always reached after the price swings back and forth between the two sides of the band. This is comparable to regression to the mean.
The bands serve as dynamic levels of support and resistance in this situation. Place a sell order with a stop loss just above the band if the price touches the top of the band to hedge against a break out. In order for you to profit, the price should move back down toward the average and possibly down to the bottom band.
Moving Average Convergence Divergence (MACD)
The moving average convergence/divergence (MACD), usually known as the MACD, is a popular indicator for cryptocurrency trading. This is because it is simple to use and can generate reliable crypto trading signals. This technical indicator is a tool for identifying moving averages that are signaling a new trend, whether it is bullish or bearish. Finding a trend is crucial in trading, after all, as that is where the most profit is made.
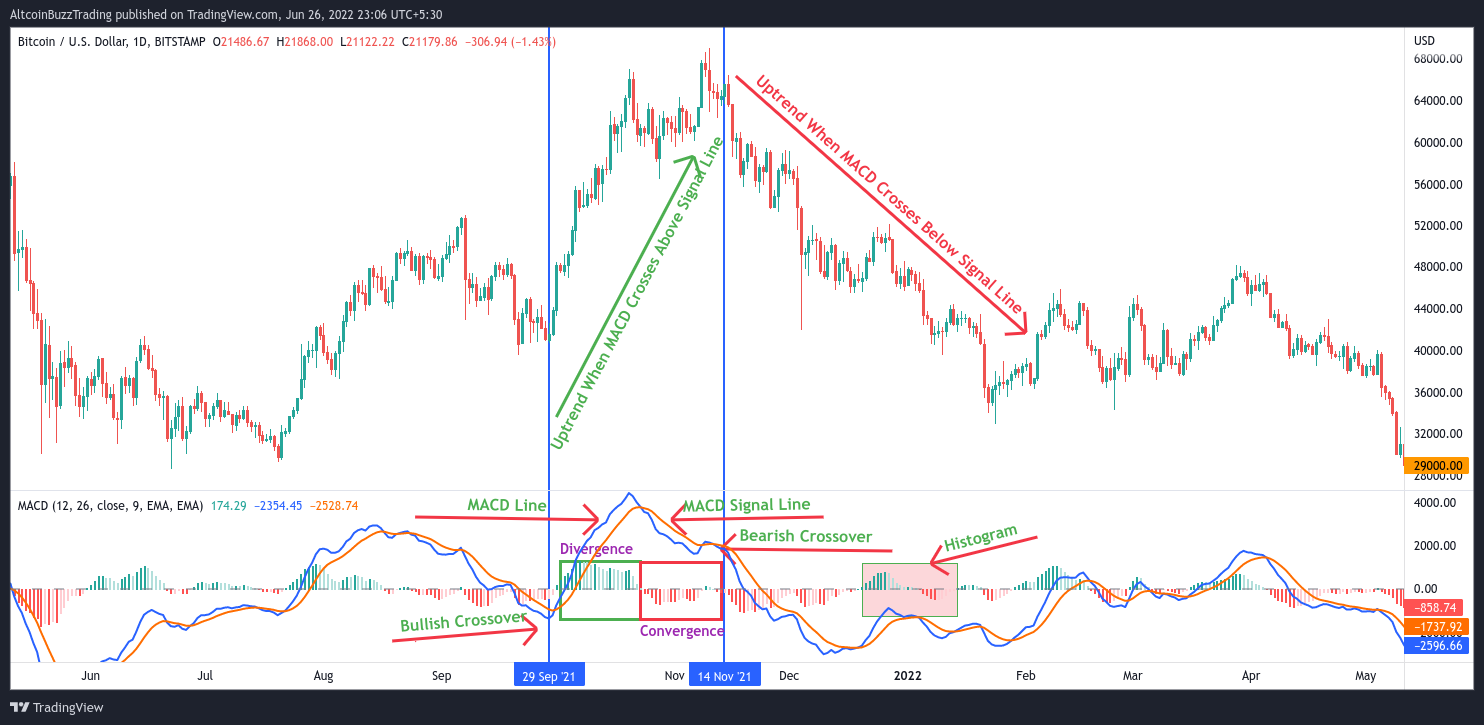
The MACD is a trend-following indicator that evaluates if the short-term price momentum is keeping up with the long-term price momentum, and if not, it is used to predict whether a trend change is imminent. The MACD line, signal line, zero line, and histogram are the four components that make up the MACD.
Check out the Bitcoin price graph above. Around September 29, 2021, the MACD line (purple) and Signal line (orange) crossed each other. This shows that the prior downward trend has stopped and that an upward trend is beginning. Additionally, on or about November 14, 2021, the blue MACD line crossed below the orange Signal line. This shows that the previous upswing is over and that a new downturn is beginning.
Conclusion
You can see that indicators are a very useful tool for you. They can boost your confidence in trading by helping you determine when to enter a trade, the market’s direction, and more generally. Indicators, however, struggle on their own. Combining indicators is a terrific strategy to increase your trust in your positions, prevent fakeouts, and ultimately increase your profits because of this.
And for our best, freshest research on NFT buys, Layer 1 chains, DeFi, or games, come check out Altcoin Buzz Access. Plans start at only $99 per month
For more information on cryptocurrency, visit the Altcoin Buzz YouTube channel.
Images courtesy of TradingView.
Disclaimer
The information discussed by Altcoin Buzz is not financial advice. This is for educational and informational purposes only. Any information or strategies are thoughts and opinions relevant to accepted levels of risk tolerance of the writer/reviewers and their risk tolerance may be different than yours. We are not responsible for any losses that you may incur as a result of any investments directly or indirectly related to the information provided.
Do your own due diligence and rating before making any investments and consult your financial advisor. The researched information presented we believe to be correct and accurate however there is no guarantee or warranty as to the accuracy, timeliness, completeness. Bitcoin and other cryptocurrencies are high-risk investments so please do your due diligence. Copyright Altcoin Buzz Pte Ltd. All rights reserved.


