One of a crypto coins is showing weakness that most traders aren't seeing yet.
 MON$0.022505+2.47%
Asset | MON (MON/USDT) |
Price at Analysis | $0.02 |
Timeframe | Daily candle |
Date | September 17, 2026 |
Bias | BEARISH |
My Trade | Short: momentum collapse and resistance stack |
Cumulative Score | 3.9 / 10 |
200-day EMA | $0.02, price is at |
Bias Invalidation | Above $0.03 with volume: thesis broken |
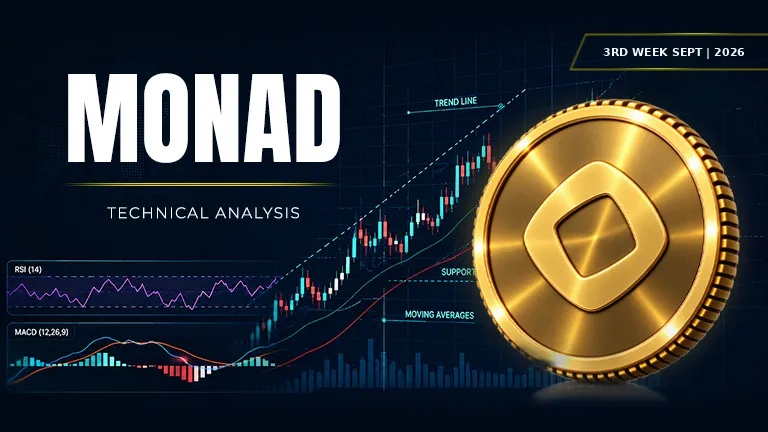
Monad MON price sits at $0.02 as of September 17, 2026, pinned at critical levels where every nearby barrier is resistance rather than fuel. The Monad price sits directly at its 20, 50, 100, and 200-day exponential moving averages, a rare alignment that suggests consolidation rather than momentum. We are nowhere near all-time highs, and the weight of technical evidence is stacking against buyers here.
The dominant narrative across Monad crypto price indicators is one of weakness despite a Double Bottom pattern that keeps a small bullish light on. The Monad project shows a cumulative score of just 3.9 out of 10, reflecting overwhelmingly bearish structure across momentum, volume, and trend tools. Ten separate technical lenses point downward; only the chart pattern breaks ranks, making this a short-biased setup with limited room for optimism.
RSI: Why is Monad (MON) price dropping?
The relative strength index at 42.4 sits below the midpoint of 50, confirming that sellers hold slight control and momentum is neither strong nor weak. This reading is in the neutral-to-weak zone, neither oversold nor overbought, meaning there is no extreme reversal signal yet. The MON price action lacks the bullish spike that would suggest capitulation or the bearish dive that would confirm panic selling.
Score: 4.5 / 10 | Neutral
Moving Averages: All four aligned at the same price level
The Monad MON price analysis and chart reveal an unusual technical setup where the EMA 20 is $0.02, EMA 50 is $0.02, EMA 100 is $0.02, and EMA 200 is also $0.02. This rare convergence of all major moving averages suggests price is stuck in a sideways channel with no clear directional bias from the longer timeframes. When price is flat against every major EMA, the macro trend is stalled, and the 200-day EMA at $0.02 means Monad has no uptrend support underneath.
Score: 2.5 / 10 | Bearish
Bollinger Bands: Trapped inside a tight squeeze
The Monad price sits exactly at the mid-band of $0.02, with an upper band at $0.03 and lower band at $0.02, creating a very narrow volatility envelope. This tight squeeze signals that volatility has contracted sharply, which typically precedes a breakout, though the direction remains uncertain. Price is equidistant from mean and upper band, offering neither breakout energy nor a collapse toward support.
Score: 3 / 10 | Bearish
Fibonacci Retracements: Price trapped between key structural levels
The swing high is $0.03 and the swing low is $0.02, creating a Fibonacci grid where price currently sits near the 0.236 and 0.382 levels, both around $0.02. The 0.500 level sits at $0.03, directly at the upper Bollinger Band and acting as overhead resistance. This structural alignment suggests MON price prediction 2026 will hinge on whether the coin can break above $0.03 with conviction or fall back to lower retrace levels.
Score: 4 / 10 | Bearish
Support Levels: Stacked but close to price
Support exists at $0.02 across four distinct levels, meaning there is a thick foundation of demand directly beneath current price. However, all four support zones are clustered at the same level, offering minimal distinction and suggesting that once this zone breaks, the next level of real support may be much lower. The proximity of support to current price leaves little buffer for downside traders to execute, making this a tight but dangerous setup.
Score: 5.5 / 10 | Neutral
Resistance: Stacked overhead with no relief
Resistance is found at $0.02 (two levels), $0.03, and $0.03, creating a double blockade where near-term ceiling is $0.03. This stacked overhead supply means that any bounce in MON price will face immediate seller walls at the upper Bollinger Band and the 50% Fibonacci retracement. The tightness of these resistance zones relative to current price suggests breakout attempts will be labored and prone to rejection.
Score: 3 / 10 | Bearish
Trendline: Ascending but price is still below
The ascending trendline sits at $0.03, which is above current price, meaning that despite a rising trend structure, Monad has not yet reclaimed the trendline in this uptrend. This divergence between the trendline level and actual price is a warning sign that the uptrend may be losing steam. For the trendline to become a bullish support, price would need to close above $0.03 with volume, which has not yet occurred.
Score: 4 / 10 | Bearish
MACD: Momentum in the red and weakening
The MACD line sits at -0.000757, the signal line at -0.000287, and the histogram at -0.000470, meaning both line and signal are negative and the histogram is also negative. The line is below the signal and moving further away, confirming that momentum is deteriorating rather than turning around. This negative alignment on MACD is a classic warning that upside is losing strength and a downside move could accelerate.
Score: 3 / 10 | Bearish
On-Balance Volume: Falling distribution pattern
On-balance volume is in a falling trend, meaning that selling volume is outpacing buying volume and institutions or large holders are distributing their Monad holdings. This divergence between price and volume is one of the most reliable sell signals in technical analysis, as it suggests that any bounce lacks conviction. When OBV is falling, breakouts above resistance are less likely to hold, and weakness tends to accelerate on volume.
Score: 3 / 10 | Bearish
Chart Patterns: Double bottom suggests a reversal, but...
The double bottom pattern is the sole bullish signal in this analysis, suggesting that price has touched support twice and could be ready to bounce. However, the measured target of a double bottom would be roughly $0.03 to $0.04, which means the pattern only offers a modest upside if it resolves bullishly. Against nine bearish indicators, one double bottom is insufficient to change the overall bias, and Monad price prediction 2030 will depend on whether this pattern breaks down or holds and completes.
Score: 6.5 / 10 | Bullish
Indicator | Reading | Score / 10 |
|---|---|---|
RSI (14) | Below 50, neutral but lacking strength | 4.5 |
EMAs (20 / 50 / 100 / 200) | All at $0.02, no directional trend | 2.5 |
Bollinger Bands | Squeezed at mid-band, volatility flat | 3 |
Fibonacci | Trapped between retracement levels | 4 |
Support | Thick cluster at $0.02, near price | 5.5 |
Resistance | Stacked at $0.02 and $0.03 | 3 |
Trendline | Rising at $0.03 but price below | 4 |
MACD | Negative line, signal, and histogram | 3 |
On-Balance Volume | Falling, volume confirms selling pressure | 3 |
Chart Patterns | Double bottom bullish but limited upside | 6.5 |
Cumulative Average | BEARISH bias, I'm going short | 3.9 |
I'm taking a short position here because the cumulative score of 3.9 out of 10 reflects a clear preponderance of bearish technicals, and I want to fade this consolidation. My entry is right here or on any bounce into the $0.02 to $0.03 zone, and I'm targeting a break below the support level at $0.02. The falling OBV, negative MACD, and stacked resistance make this a favorable risk-reward short that lets me sell Monad crypto into resistance with limited upside room above me.
My entry zone | $0.02 – $0.03 |
My stop loss | $0.035 (above upper Bollinger Band and trendline) |
My target 1 | $0.02: Support cluster |
My target 2 | $0.015: Fib 0.618 extended |
My target 3 | $0.01: Lower pivot zone |
Risk : Reward | 1 : 2 (T1) / 1 : 3.5 (T2) |
Position | Short / leveraged short |
I would exit this short if price closes decisively above $0.03 with volume that breaks the upper Bollinger Band and reclaims the ascending trendline. My thesis is wrong if OBV stops falling and starts rising in tandem with an upside move, as that would confirm buyers have arrived and the double bottom pattern is completing. If these conditions align, I would close my short position and consider flipping long, but until price proves it can hold above resistance with volume behind it, I remain biased short and would be risking further downside.
Disclaimer: This article is produced for informational and educational purposes only and does not constitute financial or investment advice. Cryptocurrency markets are highly volatile and carry significant risk. Always conduct your own research and consult a qualified financial adviser before making any trading decisions.
Aster crypto price hovers at a crossroads as bullish signals clash with falling selling pressure.

Ethereum faces a pivotal moment. My analysis reveals why long positions matter right now.
 ETH
ETH
Zcash is surging toward key resistance, yet momentum indicators are starting to crack.
 ZEC
ZEC
