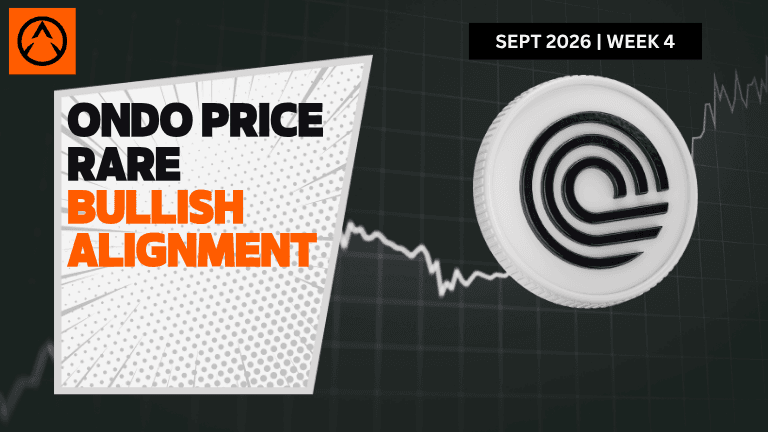
One chart shows Ondo Finance crypto climbing with almost every signal pointing the same direction.
Asset | ONDO (ONDO/USDT) |
Price at Analysis | $0.57 |
Timeframe | Daily candle |
Date | September 28, 2026 |
Bias | BULLISH |
My Trade | Long: aligned EMAs plus rising OBV |
Cumulative Score | 7.4 / 10 |
200-day EMA | $0.34, price is above |
Bias Invalidation | Close below $0.40 with a daily close outside the ascending trendline |
Ondo Finance ONDO price currently trades at $0.57 on September 28, 2026, positioning itself firmly above all four major exponential moving averages and trading well within the middle and upper zones of the Bollinger Bands. The asset is far from its swing high of $0.61 but commanding a significant premium above the 200-day EMA at $0.34, which signals a firmly established uptrend in the broader timeframe. The market structure shows price sitting near the upper band at $0.59, suggesting controlled momentum rather than runaway buying.
The weight of technical evidence is decidedly bullish across the 10 indicators tracked here. Ondo Finance price demonstrates strong alignment in its moving averages, with the 20-day EMA at $0.45, 50-day at $0.41, 100-day at $0.38, and 200-day at $0.34 all stacked in bullish order below price. The RSI reading of 71.6 sits in the overbought territory but remains below the extreme ceiling of 80, the MACD histogram is positive and widening, the OBV trend is rising to confirm accumulation, and the ascending trendline at $0.48 provides structural support. The only genuine weakness in the setup lies in support levels, which score just 3.5 out of 10 due to limited cushion between current price and the first support zone.
RSI: Why is Ondo Finance (ONDO) price rising with overbought momentum?
The RSI(14) reading of 71.6 places Ondo Finance ONDO price in overbought territory, above the 70 threshold that typically signals exhaustion. However, this level is not extreme; the RSI remains beneath 80, which means there is still room for momentum to push higher without necessarily triggering a sharp pullback. The fact that RSI has climbed to this level shows aggressive buying pressure behind the move, and as long as price continues to find buyers at higher levels, the overbought signal is less bearish than it might appear on first glance.
Score: 8 / 10 | Bullish
Moving Averages: All four EMAs stacked in bullish formation
Ondo Finance price sits cleanly above all four exponential moving averages, with the 20-day at $0.45, 50-day at $0.41, 100-day at $0.38, and 200-day at $0.34 creating a textbook bullish alignment. When all four EMAs are stacked in ascending order with price above them all, it is one of the strongest structural bullish signals available in technical analysis. The 200-day EMA in particular acts as a long-term trend anchor, and Ondo Finance crypto price remaining well above this level at $0.34 indicates that the broader uptrend is intact and macro conditions favor buyers. This alignment is precisely what traders look for when building conviction in a sustained move higher.
Score: 9 / 10 | Bullish
Bollinger Bands: Upper band providing dynamic resistance
The Bollinger Bands show Ondo Finance (ONDO) to USD trading very near the upper band at $0.59, with the midline at $0.42 and lower band at $0.26 defining the full volatility envelope. When price trades near the upper band, it typically signals that momentum is strong but also that the asset is testing its current overbought extreme. The wide spacing between the upper band at $0.59 and the midline at $0.42 indicates elevated volatility, which is healthy for a move this early in its progression. Price touching the upper band is not necessarily a signal to sell; it is often a sign that the trend is powerful enough to carry the asset to its extreme.
Score: 7.5 / 10 | Bullish
Fibonacci Retracements: Price holding above critical structural levels
From the swing low of $0.29 to the swing high of $0.61, the Fibonacci retracement levels provide a mathematical roadmap for support and resistance. Ondo Finance ONDO price at $0.57 is currently trading between the 0.786 Fib level at $0.54 and the 0.618 level at $0.49, positioning it in the upper half of the measured move. This zone is highly significant because it is where buyers have historically defended price and where failed rallies tend to break down. The fact that price is holding above $0.54 shows that buyers are in control, and a drop below this level would be the first serious warning sign. For Ondo Finance price prediction 2026, maintaining price above the 0.618 Fib at $0.49 will be crucial to sustaining the bullish narrative.
Score: 9 / 10 | Bullish
Support Levels: Proximity to first support is the main vulnerability
Support zones are identified at $0.40, $0.37, $0.34, and $0.32, with the closest cushion being just $0.17 below current price to the first level at $0.40. This lack of nearby support is the primary structural weakness in the current setup and explains why the support score is only 3.5 out of 10. If price loses the $0.40 zone, the next meaningful cluster does not arrive until $0.37, and from there the 200-day EMA at $0.34 would provide macro-level support. However, the tightness of support also means that a breakdown would likely trigger cascading liquidations and accelerate any downside move. Traders buying at current levels should be mindful that a quick stop loss below $0.40 is essential risk management.
Score: 3.5 / 10 | Bearish
Resistance: Clear skies above current price
No major resistance levels have been identified above current price, which is remarkably bullish for the short-term outlook. The nearest overhead supply is the swing high of $0.61, which was recently tested and offers psychological resistance, but above that price has clear room to run. When an asset moves higher without encountering significant resistance zones, it signals that selling pressure has been absorbed and that breakout buyers are in command. This absence of stacked overhead supply is one of the most encouraging features of the Ondo Finance ONDO price analysis and chart, as it removes friction from any further upside moves. Traders looking to buy Ondo Finance crypto should appreciate that the path of least resistance is decidedly higher.
Score: 8 / 10 | Bullish
Trendline: Ascending structure holding price aloft
The dominant trendline is ascending and currently sits at $0.48, providing dynamic support that price is trading well above. An ascending trendline is drawn by connecting successive higher lows and represents the structural heartbeat of an uptrend. As long as Ondo Finance price remains above this trendline, the uptrend is considered intact and in force. The fact that price is trading nearly $0.09 above the trendline shows that the move is commanding, not marginal. Should price close decisively below the trendline of $0.48, it would represent the first material break in uptrend structure and would warrant a reassessment of the bullish thesis.
Score: 8 / 10 | Bullish
MACD: Positive histogram with momentum still building
The MACD line at 0.051930 is trading above the signal line at 0.032376, creating a positive histogram of 0.019554 that confirms bullish momentum is in force. When the MACD line crosses above the signal line, it generates a bullish crossover signal, and the widening positive histogram shows that momentum is not weakening but rather accelerating. This is a textbook bullish MACD setup and provides additional confirmation that the move in Ondo Finance price has genuine directional conviction. The magnitude of the histogram, while positive, is not extreme, which suggests there is still room for momentum to expand higher before reaching an exhaustion zone.
Score: 8.5 / 10 | Bullish
On-Balance Volume: Buying pressure confirmed by accumulation
The OBV trend is rising, which provides crucial confirmation that the price move higher is backed by real buying pressure and not just a technical bounce on thin volume. On-Balance Volume is one of the most reliable ways to separate genuine directional moves from noise, because it aggregates the volume data with price direction. A rising OBV in tandem with rising price is exactly what bulls want to see, as it signals that aggressive buyers are entering the market. This convergence between price strength and volume strength gives much more credibility to the notion that Ondo Finance price prediction 2030 could involve significantly higher levels, as the foundation is being built on genuine accumulation rather than speculation.
Score: 7 / 10 | Bullish
Chart Patterns: No clear pattern yet, but structure remains intact
Currently, no clear chart pattern has formed in the ONDO/USDT daily timeframe, which means price is not yet in a classifiable formation like a triangle, flag, cup and handle, or other geometric setup. The absence of a clear pattern is neither bullish nor bearish; it simply reflects that price has been moving in a relatively straightforward manner without forming a recognizable reversal or consolidation structure. As long as price continues higher, the directional momentum will remain the dominant narrative, and a pattern may only emerge if price consolidates or pulls back. The score of 5 reflects this neutrality.
Score: 5 / 10 | Neutral
Indicator | Reading | Score / 10 |
|---|---|---|
RSI (14) | Overbought at 71.6 but not extreme, momentum intact | 8 |
EMAs (20 / 50 / 100 / 200) | All stacked bullishly below price at $0.45 / $0.41 / $0.38 / $0.34 | 9 |
Bollinger Bands | Price near upper band at $0.59, elevated volatility favors buyers | 7.5 |
Fibonacci | Trading between 0.786 and 0.618 levels, upper half of move | 9 |
Support | First level at $0.40 is only $0.17 away, thin cushion below | 3.5 |
Resistance | No major levels above, clear skies to swing high at $0.61 | 8 |
Trendline | Ascending trendline at $0.48 holds, price well above structure | 8 |
MACD | Line above signal, positive histogram at 0.0196, momentum expanding | 8.5 |
On-Balance Volume | Rising OBV confirms buying pressure, accumulation phase active | 7 |
Chart Patterns | No clear pattern formed, price moving directionally without structure | 5 |
Cumulative Average | BULLISH bias with score 7.4 out of 10 supports long entry | 7.4 |
I am going long on Ondo Finance ONDO price here because the cumulative technical score of 7.4 out of 10 provides solid conviction, and the alignment of all four moving averages stacked below price combined with rising OBV gives me confidence that this is a genuine directional move rather than a false breakout. My entry zone is between $0.55 and $0.57, which allows me to buy Ondo Finance crypto near current price while still maintaining some flexibility for a small pullback into the $0.53 zone before committing fully. I am risking a close below the $0.40 support level as my invalidation point, which gives me a 1 : 2.2 risk-to-reward ratio on my first target, making this a mathematically sound trade setup.
My entry zone | $0.55 - $0.57 |
My stop loss | $0.39 (below first support at $0.40 to allow wick penetration) |
My target 1 | $0.61 - swing high resistance |
My target 2 | $0.65 - measured move from $0.29 low to $0.61 high |
My target 3 | $0.70 - extended projection above swing high |
Risk : Reward | 1 : 2.2 (T1) / 1 : 3.5 (T2) |
Position | Long |
I would exit my long position and flip bearish if Ondo Finance price closes decisively below the $0.40 support level with confirmation on volume, as this would signal a break of the first meaningful support cluster and suggest that buyer conviction has evaporated. My thesis is also wrong if price closes below the ascending trendline at $0.48 on a daily basis, which would indicate that the uptrend structure is breaking and that a more serious pullback or reversal may be underway. Additionally, if the RSI drops sharply below 50 while price is still above $0.50, it would represent a divergence that could warn of an imminent pullback, and I would reduce my position size at that point. Is Ondo Finance a good long-term investment? The answer depends on whether price can hold above these key structural levels and continue to attract accumulation; if it fails to do so, the long-term thesis would need to be reassessed.
Disclaimer: This article is produced for informational and educational purposes only and does not constitute financial or investment advice. Cryptocurrency markets are highly volatile and carry significant risk. Always conduct your own research and consult a qualified financial adviser before making any trading decisions.
One metric just flashed green while others whisper caution. Here's what it means.
 DASH
DASH
Quant just flashed all green signals. Here's whether this surge has real staying power.
-768x432.png&w=3840&q=75&dpl=dpl_9gNza7xkqLDPvM933vBYyZCw9KdW)
A surging momentum indicator suggests Hyperliquid HYPE price could be ready to run significantly higher.
 HYPE
HYPE
