Solana compresses near a lower range boundary as downside pressure tightens.

Sellers remain active near the 20 EMA at $133.8, while buyers defend a weak base near $124.5. Momentum is muted, and structure remains heavy as Solana trades inside a compressed Bollinger Band range.
| Level | Price (USD) | Description |
|---|---|---|
| Support 1 | $124.5 | Lower Bollinger Band and recent reaction low where bids briefly absorbed sell pressure. |
| Support 2 | $98.9 | Macro support zone from prior breakdown with no recent acceptance above. |
| Resistance 1 | $131.8 | Range midpoint and prior flip zone where price repeatedly stalls. |
| Resistance 2 | $143.9 | Upper range cap aligned with failed rebounds and EMA rejection. |

Key reaction zones sit at $131.8 and $124.5. These levels define the active range and guide short-term positioning.
Structure remains neutral to bearish. Price holds below the 20 EMA at $133.8, the 50 EMA at $135.2, and the 100 EMA at $137.0.
Stops are commonly placed just beyond $124.5 support or above $143.9 resistance depending on trade direction.
EMAs are bearishly stacked with downward slope. This signals sustained overhead pressure and weak trend strength.
The chart favors patience. Compression inside the Bollinger Bands suggests waiting for a confirmed range break.
Retracement reactions cluster near $131.8, reinforcing it as a key equilibrium level for short-term traders.
Momentum is flat. Funding rate histogram shows mild negative bias, reflecting cautious positioning and limited long conviction.
Solana remains locked in a tight structure with declining volatility. EMA resistance and weak momentum limit upside follow-through, while support near $124.5 continues to be tested. Until price escapes this compression zone, traders remain focused on range reactions rather than trend continuation.

**The information discussed by Altcoin Buzz is not financial advice. This is for educational, entertainment, and informational purposes only. Any information or strategies presented are the thoughts and opinions of the writer/reviewers, and their risk tolerance may differ from yours. We are not responsible for any losses you may incur due to any investments directly or indirectly related to the information provided. Solana and other cryptocurrencies are high-risk investments; therefore, please conduct your due diligence. Copyright Altcoin Buzz Pte Ltd.**
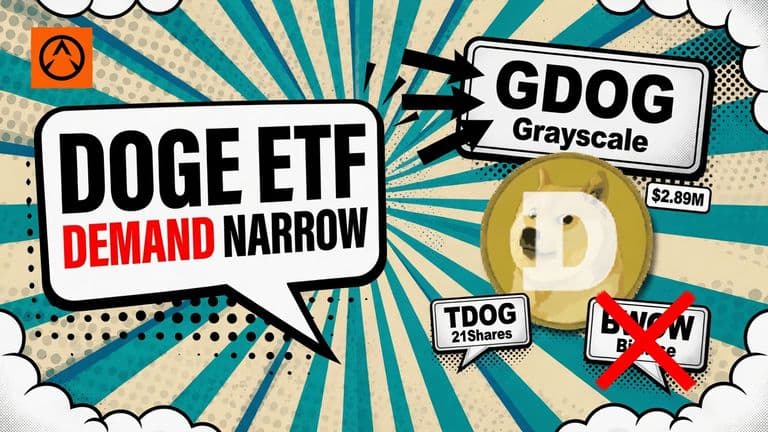
Dogecoin ETFs posted their largest weekly inflow since launch, but one Grayscale fund took all of Friday's demand and most of the group's assets.
 DOGE
DOGE BTC
BTC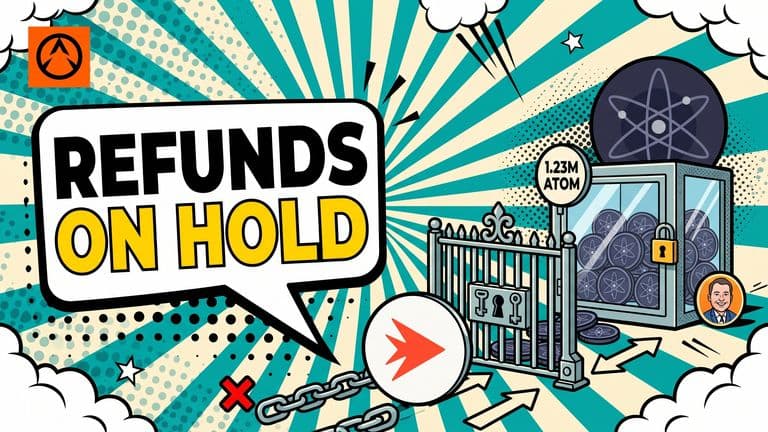
Validators moved 1.23M stolen ATOM to a recovery multisig, but a governance mandate is still required before funds can be returned.
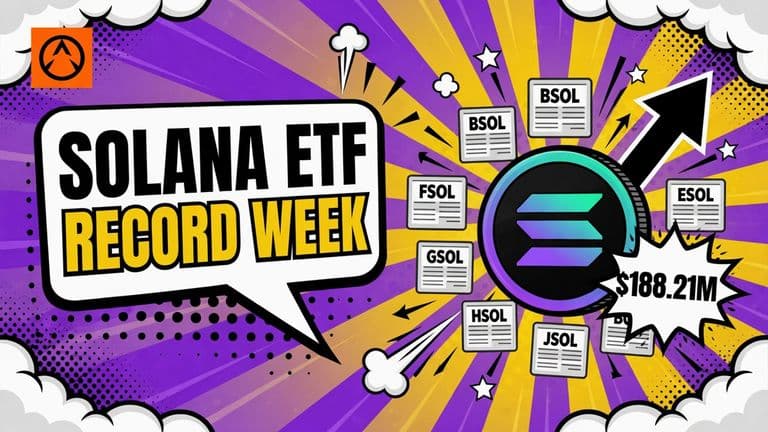
Seven US spot Solana ETFs took in a reported $188.21 million, with Bitwise’s BSOL attracting most of the capital.
 SOL
SOL
