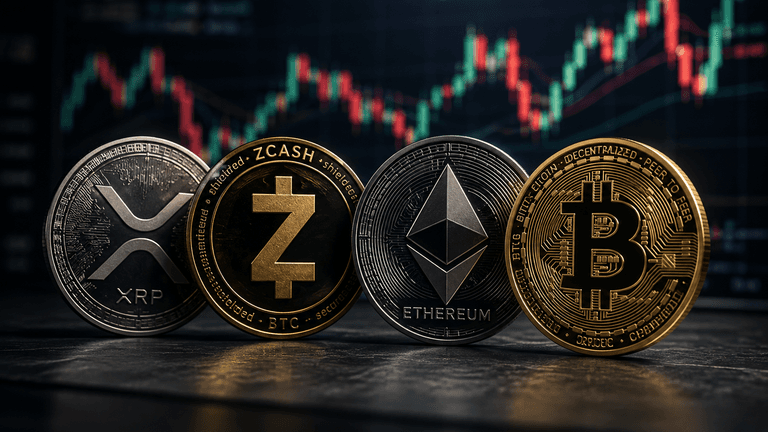
XRP remains under pressure near $1, while Zcash holds a stronger structure. Ethereum and Bitcoin face key resistance as the crypto market shows mixed signals.
 XRP$1.34+2.44%
 ZEC$1,468.03+6.40%
 ETH$2,511.66+2.70%
 BTC$78,372.00+2.26%
The crypto market is showing a mixed technical picture on August 11. While some assets are attempting to recover, others remain stuck in bearish structures.
XRP is trading close to the critical $1 support, while Zcash (ZEC) continues to hold above its major moving averages. Ethereum (ETH) is trying to build a recovery above $1,900, and Bitcoin (BTC) remains in a tight range below key resistance.
Here are the major support and resistance levels traders should watch.
XRP remains in a strong bearish structure despite its recent attempt to stabilize.
The token is trading around $1.03 after moving mostly sideways through July and early August. However, XRP has failed to establish a clear trend reversal and is now approaching the important psychological $1 support.
The moving-average structure remains bearish. XRP is trading below all four major daily moving averages.
The shorter-term averages around $1.07 and $1.09 are the first resistance levels. A move above this area would improve the short-term setup, while $1.18 is the next major resistance.
The longer-term moving average is much higher at around $1.37, making it a more difficult level for bulls to reclaim.
Momentum also remains weak. The daily RSI is around 38.3, below its signal average of 41.7. XRP is approaching oversold territory but has not reached an extreme level yet.
This means further downside remains possible.

The $1.00-$1.03 zone is the key support area. Losing this range could expose XRP to $0.95 and $0.90.
On the upside, XRP needs to reclaim $1.07-$1.09 first. A sustained move above $1.18 would provide a much stronger signal that the broader structure is improving.
Zcash is showing a much stronger technical setup than XRP.
ZEC is trading around $505 and remains above all of its major daily moving averages. The nearest dynamic support is around $497, followed by moving-average support near $481 and $469.
The long-term moving average is around $421 and is still rising. This keeps the medium-term structure constructive as long as buyers defend the $469-$481 zone.
Momentum is also balanced rather than overheated.
The daily RSI is around 52.6, slightly above its signal line near 49.5. This gives ZEC room to move higher without entering overbought territory.
The biggest challenge for bulls is the $510-$520 resistance zone. Recent candles show that sellers are still active around this area.
A breakout above $520 could open the way toward $540-$560, followed by resistance near $580.
On the downside, losing $497 would weaken the short-term setup, while a break below $469 could put the broader recovery structure at risk.

For now, ZEC has a stronger technical structure than XRP, although bulls still need to clear $520 to confirm another major move higher.
Ethereum is attempting to build a recovery around $1,900, but the token is facing a major resistance level on the daily chart.
ETH is currently trading near $1,905, just below the moving average around $1,923. This level has repeatedly limited the recovery since the June sell-off.
The short-term structure has improved significantly from the June low near $1,550. ETH has formed higher lows and reclaimed shorter-term moving averages around $1,877 and $1,806.
The $1,877 level now provides immediate support. If ETH loses that level, the $1,800-$1,805 area becomes the next important support zone.
Momentum is slightly bullish. The daily RSI is around 54.8, above the neutral 50 level.
However, buyers have yet to generate enough momentum for a confirmed breakout.
A daily close above $1,923-$1,950 would strengthen the recovery. If ETH clears this zone, the next target could be the psychological $2,000 level, followed by the longer-term moving average around $2,143.
Until then, ETH remains in a recovery attempt within a broader bearish structure.

Bitcoin continues to trade in a tight range around $64,800 as traders wait for the next major directional move.
BTC has recovered from around $58,000 and has maintained support above its shorter-term moving averages near $64,239 and $63,343.
The daily RSI is around 53.9, showing slightly positive momentum without entering overbought territory.
The main challenge is resistance above the current price.
Bitcoin faces a major barrier between $66,000 and $67,000, with a falling moving average near $66,817 adding to the resistance.
Above that, the long-term moving average sits around $72,192.
A strong breakout above $66,800 could strengthen the recovery and put the $70,000-$72,200 area back in focus.
However, a break below $63,300 could expose Bitcoin to $60,000, followed by the June low near $58,000.
For now, Bitcoin has not confirmed either a bullish reversal or a fresh breakdown. The broader trend is likely to remain uncertain until BTC decisively reclaims $66,800 and begins testing the $72,000 area.

The four assets currently show very different technical structures.
XRP: Bears remain in control below $1.18, with $1.00-$1.03 acting as critical support.
ZEC: The strongest setup of the four, with bulls needing to clear $510-$520 for further upside.
ETH: Recovering above $1,900 but facing resistance at $1,923-$1,950.
BTC: Consolidating near $64,800, with $66,800 acting as the key breakout level.
Overall, the crypto market has yet to confirm a broad-based bullish reversal. Bitcoin and Ethereum are showing signs of stabilization, while Zcash maintains a stronger structure. XRP, however, remains vulnerable as it approaches the crucial $1 support.
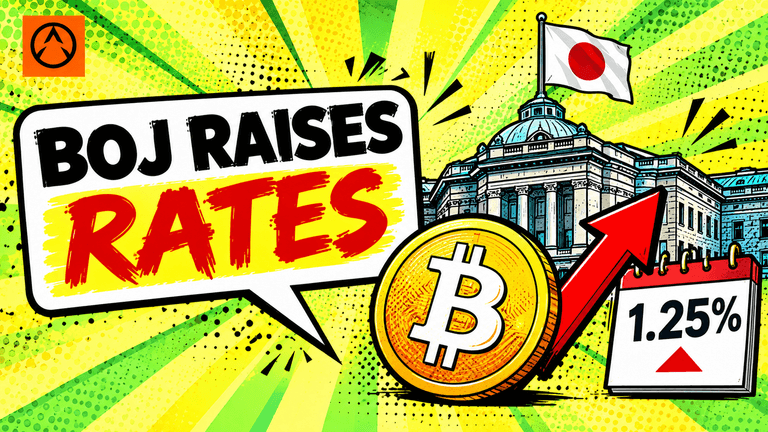
Bitcoin climbed above $77,000 after the Bank of Japan raised rates to 1.25%, while the yen weakened and markets assessed the impact on global risk assets.
BTC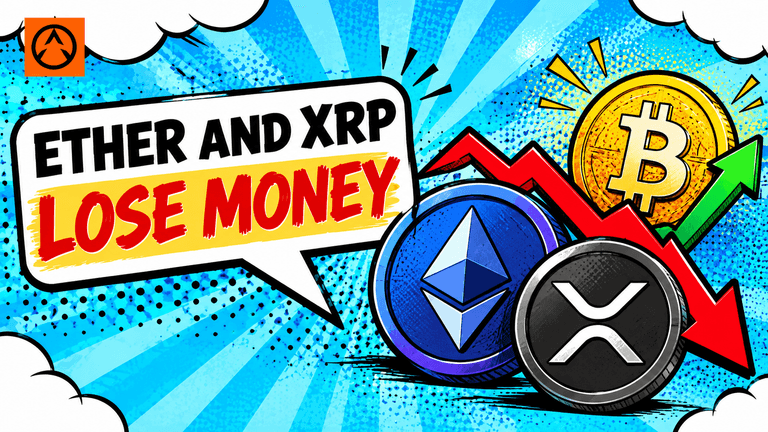
Ether and XRP ETFs saw fresh outflows as Bitcoin ETFs attracted $159 million and BTC climbed above $77,000. Zcash ETF demand also surged.
ETHXRP+1 more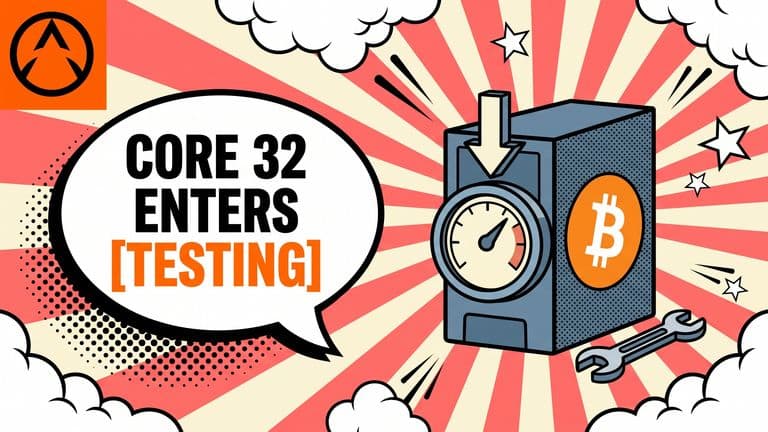
Bitcoin Core 32 adds parallel validation reads and a mempool-based fee estimator. Draft release notes also flag mining compatibility changes, wallet updates and server limits.
BTC
