How to Read Charts to Know When to Sell/Buy Your Crypto
Knowing how to read crypto charts is a huge advantage for traders.
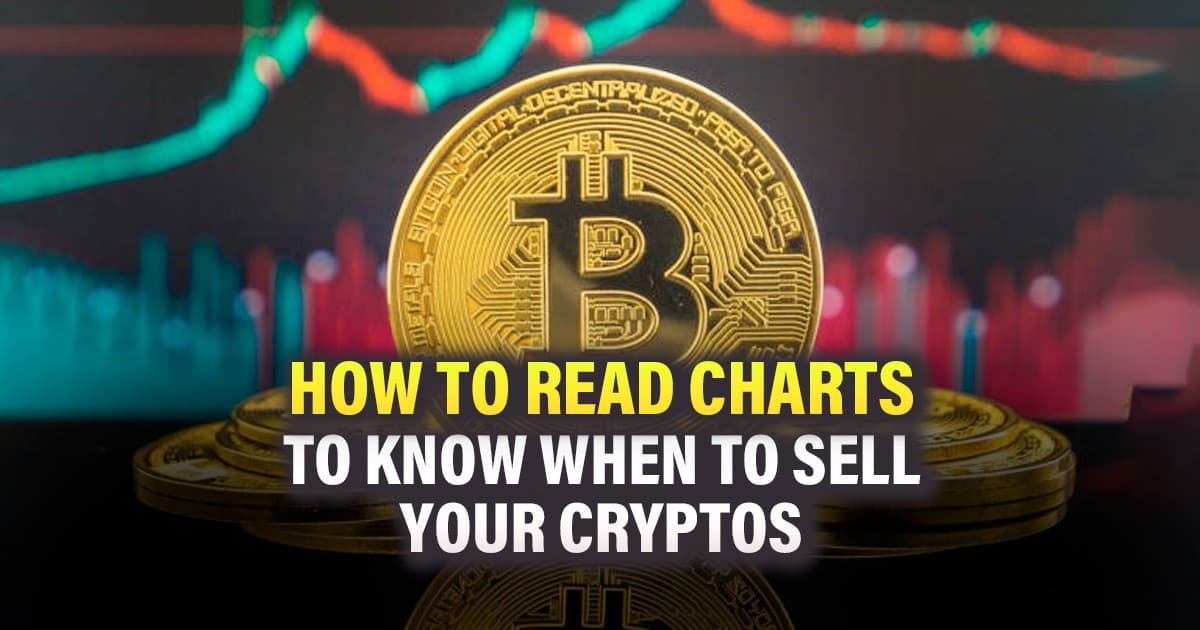
Have you ever seen a crypto chart and wondered if it was the right time to sell or buy crypto? Every trader has had this experience at some point.
This goes to show that knowing how to read a token chart is one of the best trading skills you can have. Let’s discover more about this crypto analysis.
How to Know When to Sell Your Cryptos With Charts
There are two major types of analysis in crypto:
- Fundamental analysis: This involves analyzing the basic parts of a project, such as its team, social media presence, and financial metrics. The idea is to evaluate the project’s intrinsic value
- Technical analysis (TA): As this name implies, this involves more technical information. Technical analysis, as it is known in finance, requires the ability to evaluate price movements and identify patterns in charts.
TA can be scary for a newbie. But it is not all that difficult, and it is also essential. Technical analysis informs a trader about the best possibilities for trading an asset by using market-driven data. Including trading volumes, chart patterns, and other market-based signals.
Understanding a Trading Chart
Knowing how to read charts can help you know when to buy and sell. Crypto charts are graphical representations of time intervals, volumes, and historical prices. You can use crypto charts to spot market opportunities since they create patterns based on historical price movements.
There are different candlestick patterns. Bearish and bullish candlestick patterns are the two main categories into which they fall. A bullish pattern typically portends future increases in an asset’s price, which could encourage a trader to buy in the hope that the token’s worth will rise. A bearish pattern does the opposite. It could encourage some traders to sell ahead of a possible decline in price.
Total DeFi TVL
TVL stands for Total Value Locked. It refers to the total value of assets deposited by users and locked into a protocol. But in this case, the entire DeFi space. Here is an example:
At the moment of writing this article, the DeFi sector currently has a TVL of $46.7 billion which is a drawdown of 74% from the ATHs. The combined TVL of the crypto market grew exponentially between 2020 and 2021. But, those figures have been slashed since the bear market.
Using the TVL chart is a good way to determine the right time to invest in a defi protocol. Platforms like Defillama are a good way to get TVL charts.
Google Search Volume
There’s a slight correlation between the price of Bitcoin (BTC) and search scores on Google Trends. The number of searches for the term “Bitcoin” could be a strong indicator of increased interest.
Google search volume shows that retail interest in crypto is yet to match the value of those recorded in 2020 and 2021. Current search volume shows that the crypto market is still at the levels seen in 2019.
Google search volume is another good chart to draw your data from. Google Trends is a web-based tool to discover the popularity and interest in different search terms and subjects over time. It displays the data in engaging graphs and charts.
Google Trends allows users to compare search volumes across different areas or periods, and explore public opinion in a field. It arrives at its conclusion by studying search patterns and trends. So, this platform can help you discover new trends, carry out competitor analysis, and track and analyze trends in an industry.
Weekly Crypto Developers Indicators
Developers play a huge role in crypto. They are behind ecosystems and the protocols that make up the sector. So, their activities or inactivity could be a huge indicator. Strong developer activities are often a bullish indicator. So, charts showing developer activities should be one of your tools.
Other charts to consider are:
- Ultrasoundmoney for Ethereum Metrics’’.
- Perps volume.
Understanding these charts provides the advantage of knowing when to sell your assets or buy them. This saves you from panic buying or making any uninformed choice.
Disclaimer
The information discussed by Altcoin Buzz is not financial advice. This is for educational, entertainment, and informational purposes only. Any information or strategies are thoughts and opinions relevant to the accepted levels of risk tolerance of the writer/reviewers and their risk tolerance may be different than yours. We are not responsible for any losses that you may incur as a result of any investments directly or indirectly related to the information provided. Bitcoin and other cryptocurrencies are high-risk investments so please do your due diligence. Copyright Altcoin Buzz Pte Ltd.
Next up

Uniswap Turns Outside Liquidity Into v4 Pools With Aggregator Hooks
Uniswap's Aggregator Hooks now route swaps through outside DEX liquidity as v4 pools on Ethereum, Base and Robinhood Chain, with fees feeding UNI burn.
 UNI
UNI ETH
ETHRelated
More in Crypto NewsRelated
Starknet Voters Back Research Into Becoming a Post-Quantum L1
 STRKETH
Ripple and Arf Bring RLUSD Settlement Liquidity to the XRP Ledger
 XRP
XRP RLUSD
RLUSD
Ethereum Draft Proposal Targets a Fourfold Cut in Finality Time
ETH