


")


 Tokens Playing This P2E Game")

Bitcoin was going for around $13,800 until a 30% correction came in. Now it’s currently trading at around $10,600. Are there going to be lower lows or higher highs?
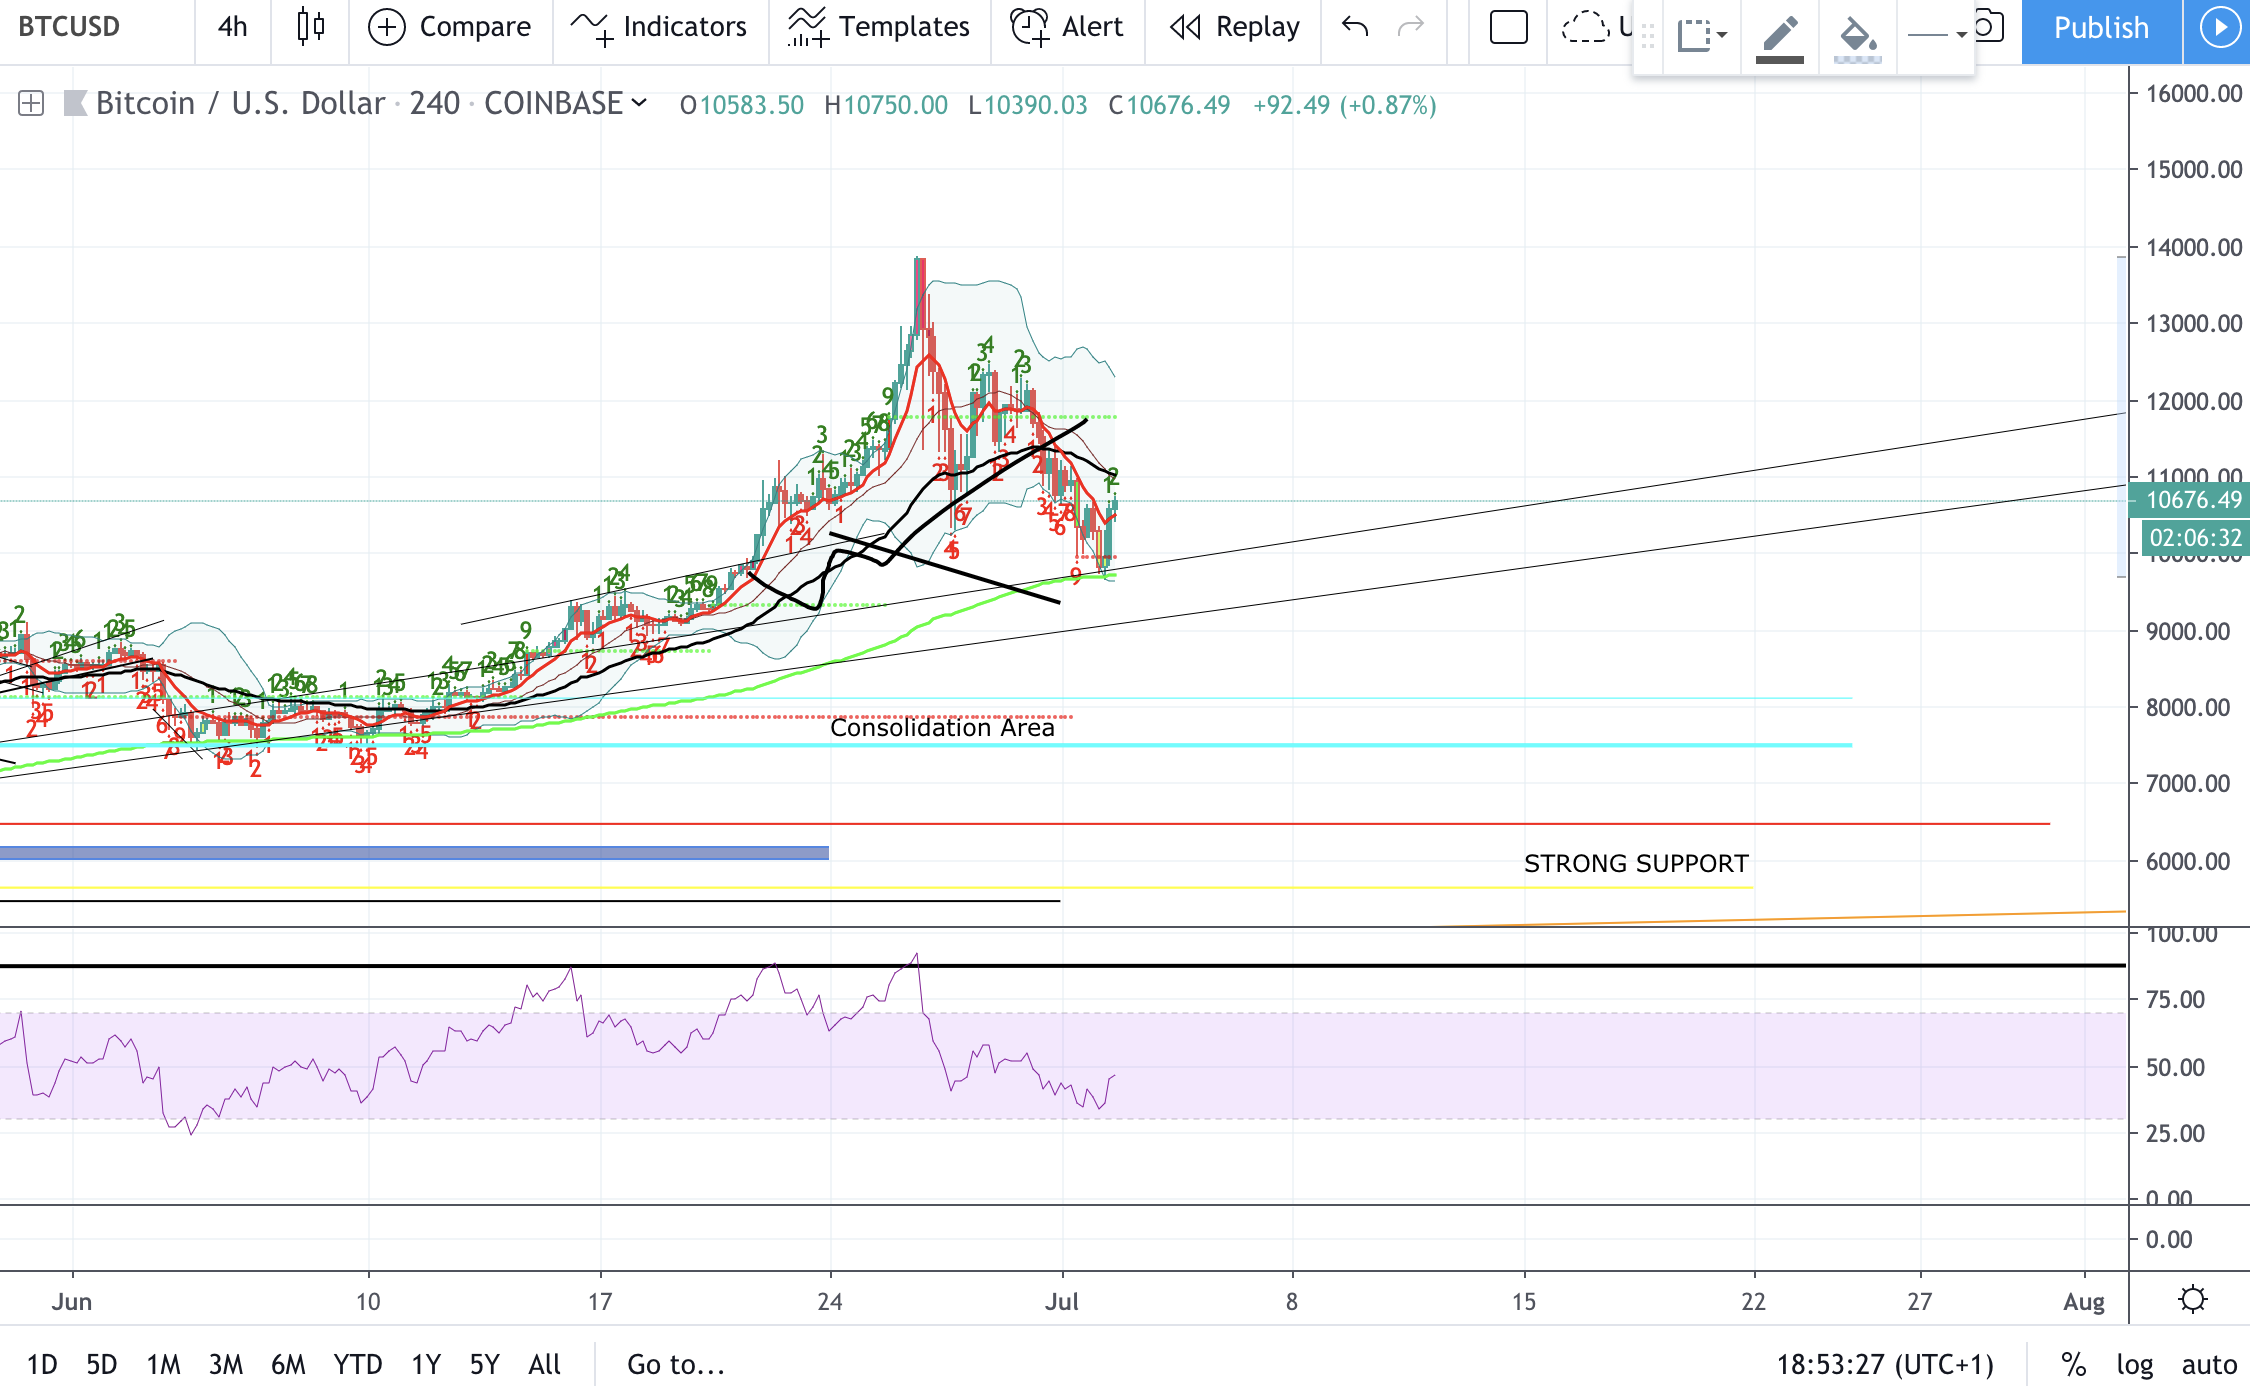
Let’s have a look at the 4-hour chart. We can see a bullish TD count, a bounce from the 200 EMA, and a nice RSI divergence. In other words, the 4-hour chart looks bullish to me.
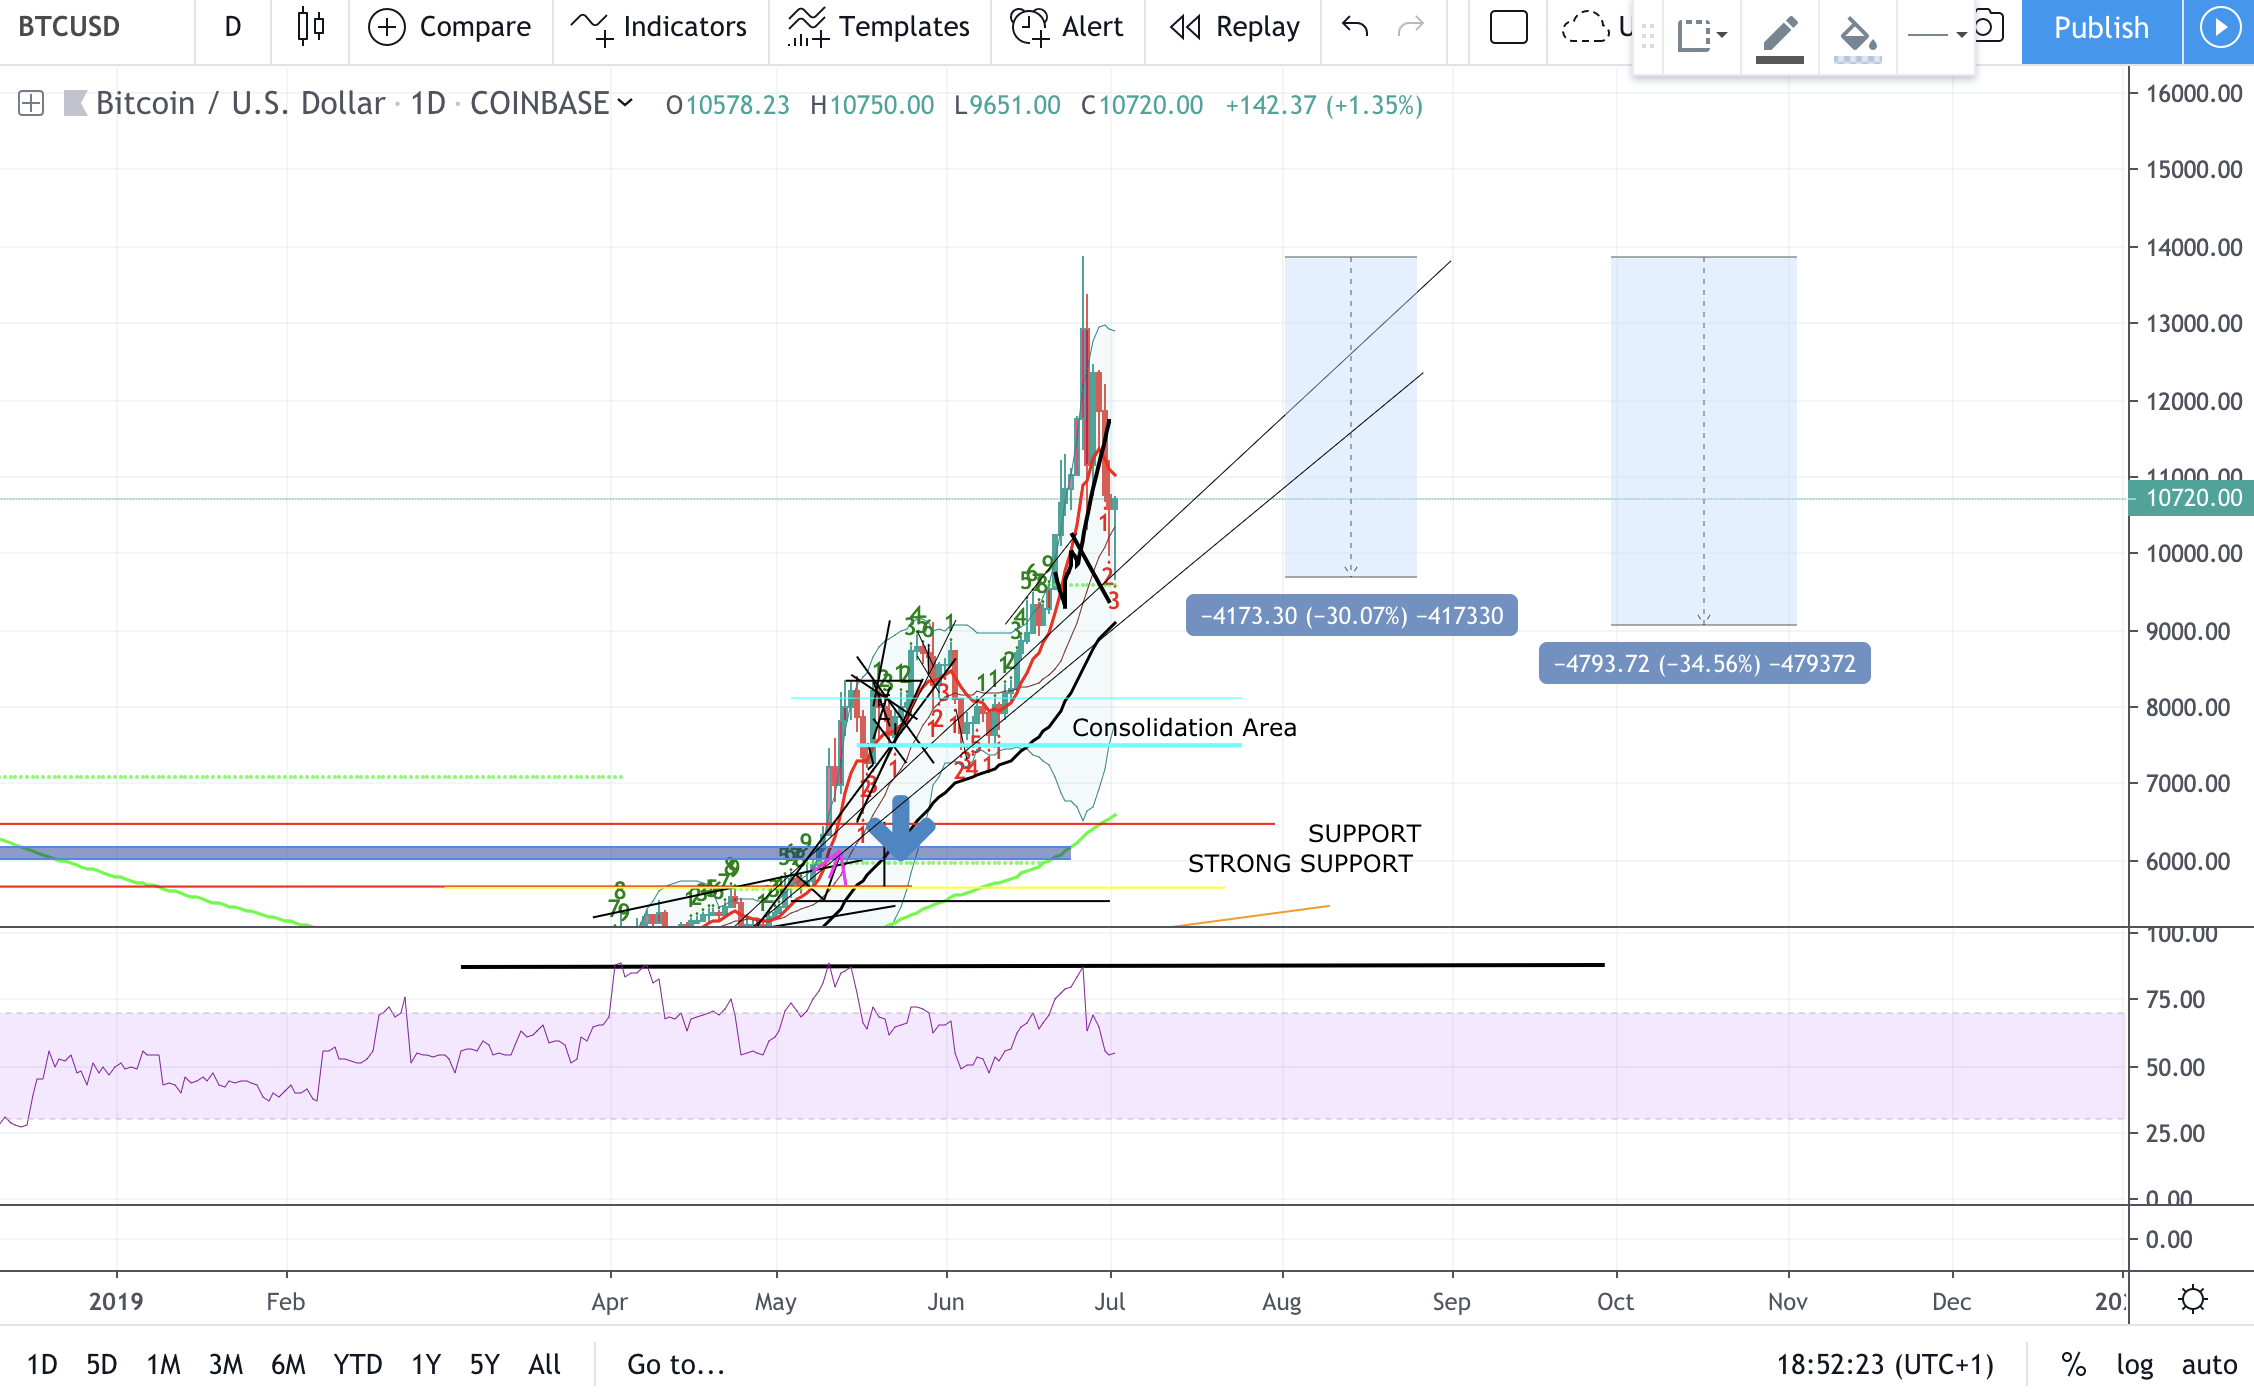
If we have a look at the daily chart, we can see an expected rejection of the RSI resistance and 2 bullish shooting stars forming.
I strongly believe we will move up from here. We may consolidate in between $11-12,000 area for a while. Another possibility is that we may end with a bullish triangle that will break bullish.
A worst-case scenario is a spike up followed by a quick dip of around 5% (from 9,700), after which the price will recover and make higher highs.
We are in a bull run and all I see is accumulation. We will keep moving up and have some considerable corrections along the way. It’s part of the market cycles.
What should we expect as the next target?
I am currently looking at around $16200 as the next target, that is where we should see another correction I believe.
You need help to understand all the technical analysis and trading terms? Click here.
Please Note: This is not financial advice, it’s just me expressing my own opinion over the market. Please do your own due diligence before investing in such volatile markets.


