


")


 Tokens Playing This P2E Game")

Created by Charles Edwards, the hash ribbons indicator predicts miner capitulation. Its buy signal has an impressive history of predicting Bitcoin rallies. It may sound intuitive that miner capitulation initially leads to drops in Bitcoin price. However, my analysis demonstrates that there is more to it than that.
What is Bitcoin miner capitulation?
Bitcoin miner capitulation occurs when the least efficient miners struggle to cover their operational costs. This leads them to sell larger and larger percentages of their mined Bitcoin. The Bitcoin halving is an event that leads to less profitable miners getting weeded out. This is due to what is effectively a halving of profits for miners.
Another event that can lead to miner capitulation is a rapid or sustained decrease in the price of Bitcoin. This happened in the November/December 2018 crash when Bitcoin dropped by 53% from $6,544 to $3,122.
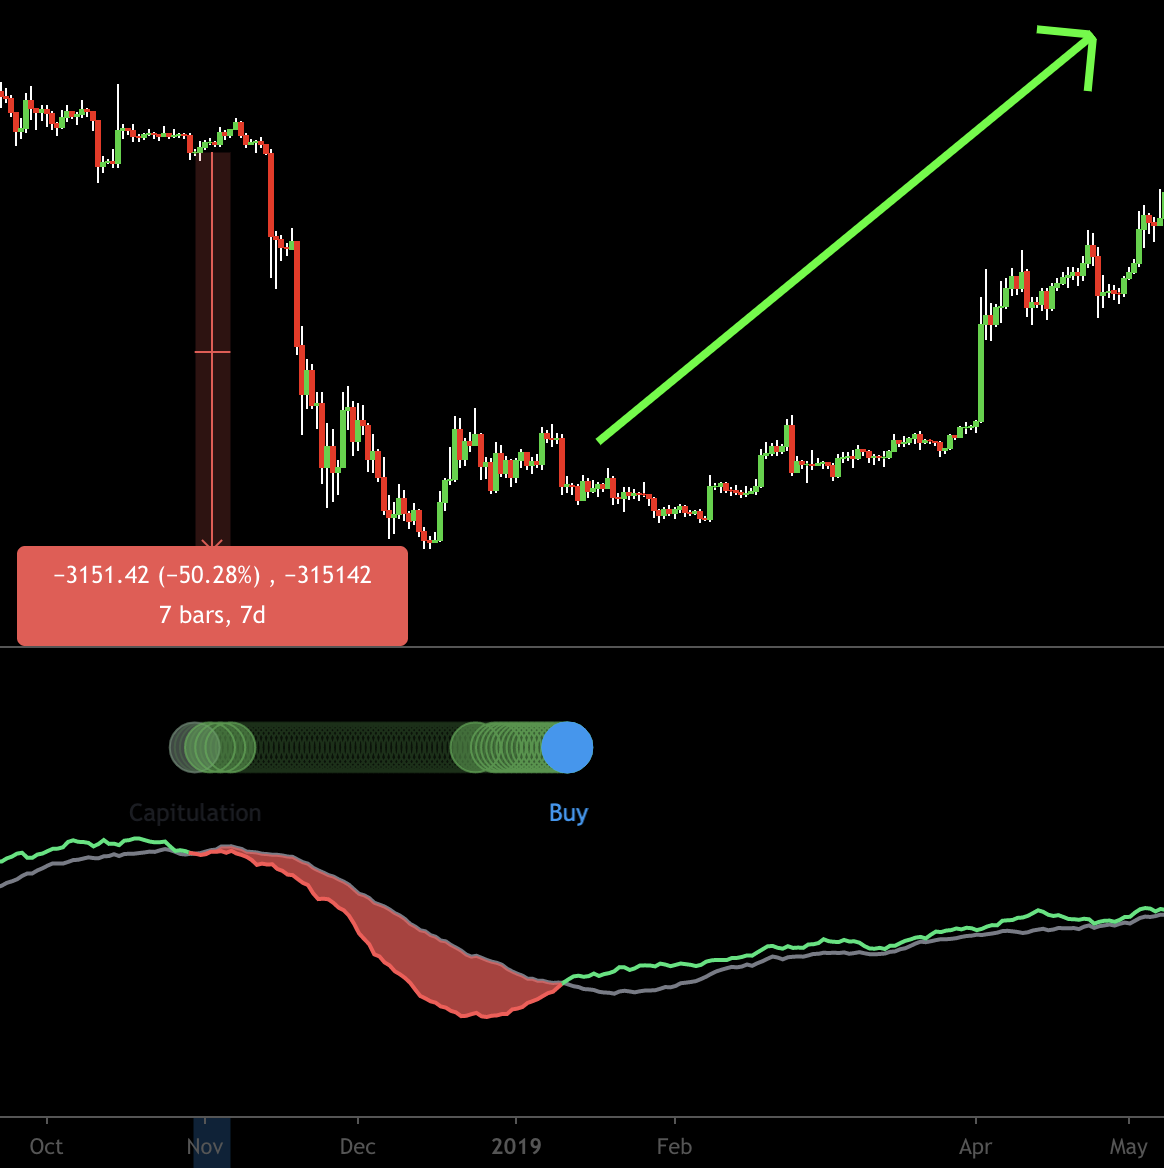
The hash ribbon displayed above is an on-chain indicator which compares moving averages of the hash rate for mining Bitcoin. When the green line (1 month SMA of Bitcoin hash rate) crosses below the grey line (2 months SMA of Bitcoin hash rate), it creates a red zone which indicates that miners are capitulating.
How did the Bitcoin price react to the “buy” signal of the hash ribbons indicator?
Charles has already presented an analysis demonstrating the impressive results of the buy signal from this indicator. His analysis covers what happens after the capitulation is over. This is when the buy signal appears.
Note that this buy signal also requires a signal of positive price momentum. This is determined by the 10-day moving average of the price crossing over the 20-day moving average.
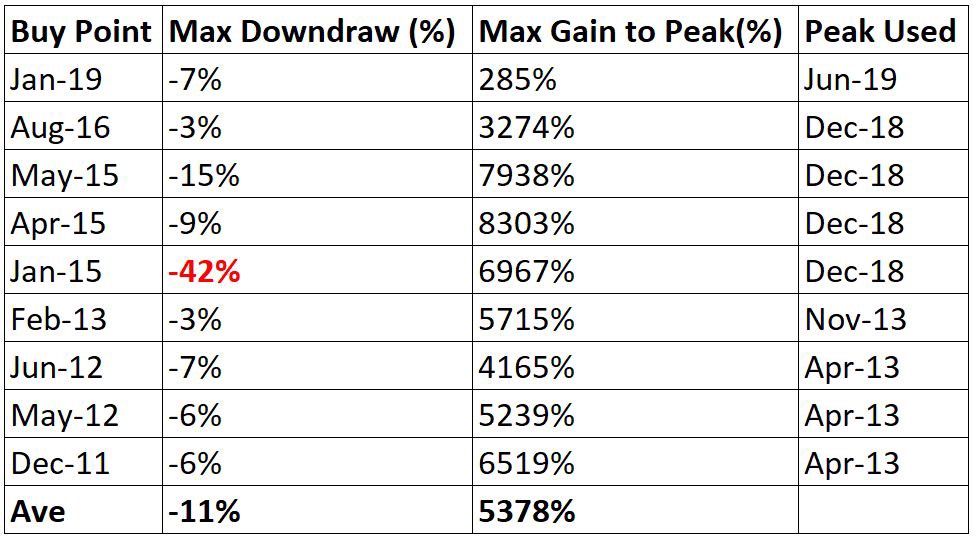
With an average drawdown (the difference between entry and lowest price point thereafter) of just 9.1% and a whopping 5,520% gain when measuring the largest peak within 3 years of entering the position, this indicator is one that Bitcoin investors would be wise to pay attention to. Again, it’s important to note that the buy signal leading to these gains is only triggered after the end of miner capitulation periods.
How has Bitcoin price been affected during miner capitulation periods?
However, what has not been so well documented is the effect that an initial crossover of the lines in the hash ribbons indicator has on price. An initial crossover of these lines which incorporate the Bitcoin mining hash rate suggests that miners have started capitulating. This intuitively leads to fear that the Bitcoin network may be struggling and that the Bitcoin price should therefore fall.
According to my analysis using BTC/USD on Bitstamp, the numbers show that prices within the miner capitulation period have been largely random. This means prices made lower lows but also higher highs.
The analysis incorporates a total of five factors. These include:
- The start date of the capitulation when the hash ribbon lines cross over.
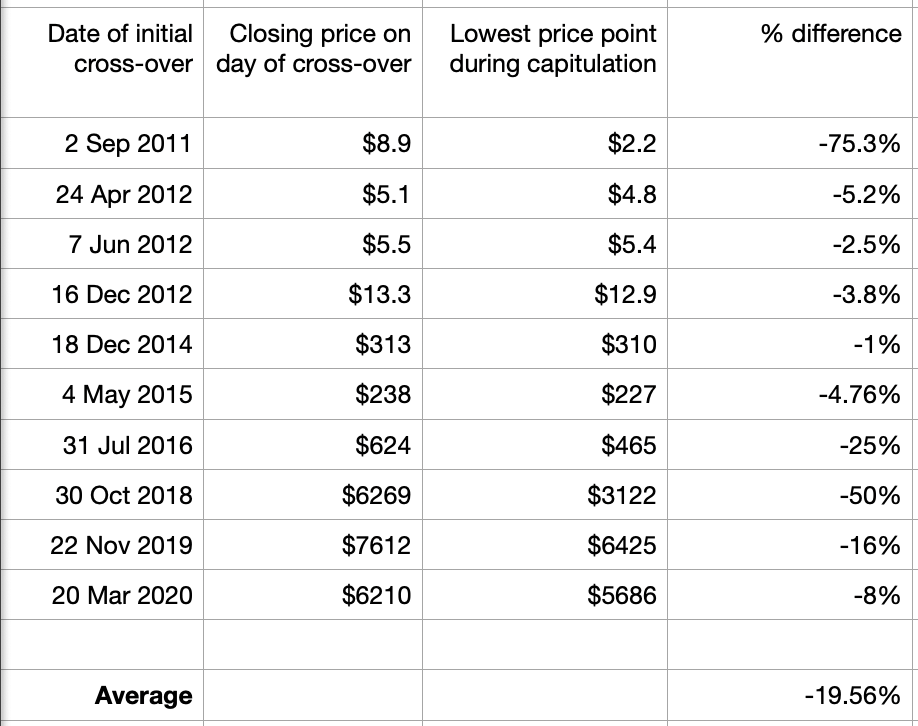
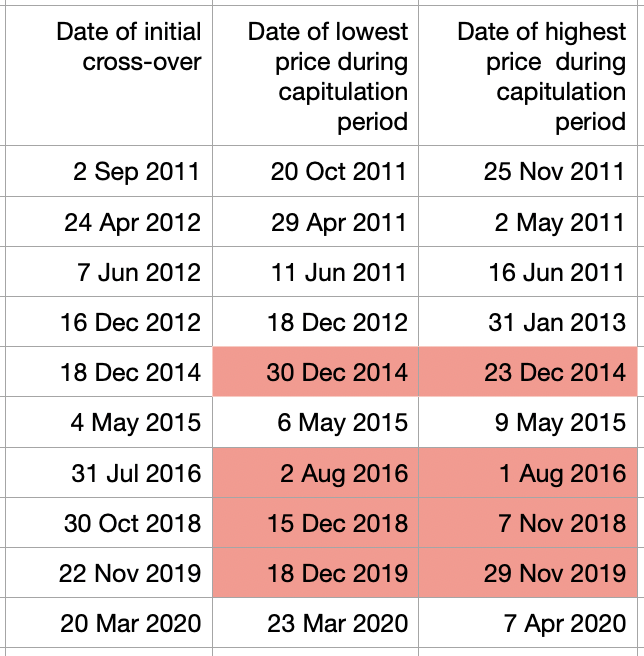
- The lowest & highest price points within the capitulation period. These are marked by the red area created when the lines cross over.
- The % differences in price between the close of the starting day and the lowest & highest price of any day within the capitulation period.
Taking a closer look
As can be seen below, the Bitcoin price saw a decrease of an average of 19.6% when comparing the starting price of the miner capitulation period to the lowest price within that period.
Surprisingly, a comparison of the starting price and the highest price within these periods shows that the price also increased by an average of 17.5%.
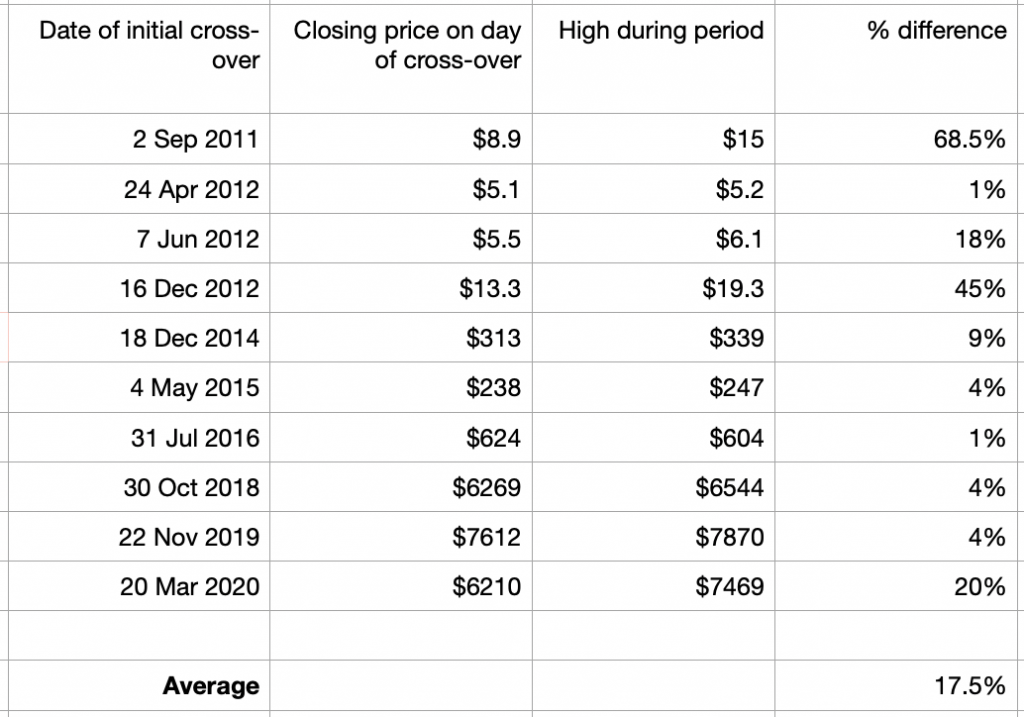
It is tempting to assume that the capitulation initially led to decreases in price followed by increases in price thereafter. However, the data says otherwise. The red cells in the table below disprove this hypothesis.
Furthermore, the average duration of a miner capitulation period is 36 days. Discounting the very first time this happened (when it lasted 91 days) during Bitcoin’s infancy, the average duration goes down to just 30 days.
It is pertinent to note that we are excluding 3 periods of miner capitulation from this analysis due to how short they were (lasting between 1-3 days). Two of these periods occurred directly before the 2015 capitulation period and one took place directly after it.
How does the recent Bitcoin halving compare to those before it?
While we have covered the effect of the halving on Bitcoin price before, there is something worthy to note about the most recent halving. According to Google Trends, the interest in this recent halving reached a record high. However, the analysis below shows that each Bitcoin halving has become less and less relevant.
After the first halving, the newly minted Bitcoin decreased from 50 to 25 Bitcoin per block. This was at a time when 10,500,000 Bitcoin had been mined – just half of the overall finite supply of Bitcoin. This was a significant change considering the ratio of newly mined Bitcoin to the existing supply of Bitcoin.
Compare this to the most recent Bitcoin halving. This time there is a decrease in the supply of newly minted Bitcoin from 12.5 to 6.25 Bitcoin per block with completed mining of 18,000,000 Bitcoin.
Comparing the third to the first halving, the supply of newly mined Bitcoin has dropped by 75%. At the same time, the existing supply has increased by almost 72%. Therefore, considering that the ratio of existing supply to newly created supply has a notable effect on Bitcoin price, every subsequent Bitcoin halving should have smaller and smaller effects on the price.
How has the buy signal affected the Bitcoin price?
The hash ribbons indicator has provided impressive buy signals for Bitcoin in the past. These buy signals occur shortly after miner capitulation periods. They have offered a highly attractive risk to reward opportunities for buying Bitcoin. Despite the strength of these buy signals, the indicator only has a sample size of 10, limiting its statistical importance. That being said, Bitcoin has only existed for 11 years. This means that any indicator of major price moves is going to have a limited sample size.
How has miner capitulation affected the Bitcoin price?
In contrast to the buy signal which occurs after the capitulation period, the initial cross over of the lines from the hash ribbons indicator has led to an average of a 19.6% pullback in the Bitcoin price. Although the average length of this period is 36 days, it has lasted anywhere between 11 and 91 days.
Nonetheless, prices within this capitulation period have not consistently seen lower lows and lower highs. Prices have indeed reached higher highs compared to the starting day of these periods every single time with an average price increase of 17.5%.
The hash ribbons indicator signaled a Bitcoin miner capitulation period on May 25. At this point, the daily candle closed at $8,900. Basing a prediction of the average drop in price during previous miner capitulation periods, we may expect the price to drop down to approximately $7,150. Conversely, once this capitulation period is over and we get the buy signal from the indicator, we may expect another one of Bitcoin’s famously exponential rallies.
Be sure to follow Altcoin Buzz so that we can inform you of when the capitulation period finishes and when the buy signal reappears.
—
Disclaimer
The information discussed by Altcoin Buzz is not financial advice. This is for educational and informational purposes only. Any information or strategies are thoughts and opinions relevant to accepted levels of risk tolerance of the writer/reviewers and their risk tolerance may be different than yours. We are not responsible for any losses that you may incur as a result of any investments directly or indirectly related to the information provided.
Do your own due diligence and rating before making any investments and consult your financial advisor. The researched information presented we believe to be correct and accurate however there is no guarantee or warranty as to the accuracy, timeliness, completeness. Bitcoin and other cryptocurrencies are high-risk investments so please do your due diligence. Copyright Altcoin Buzz Pte Ltd. All rights reserved.


