Monero XMR price is climbing hard: should you jump in yet?
This privacy coin is flashing signals that traders can't ignore right now.

By Pratik OswalChief Technical Analyst
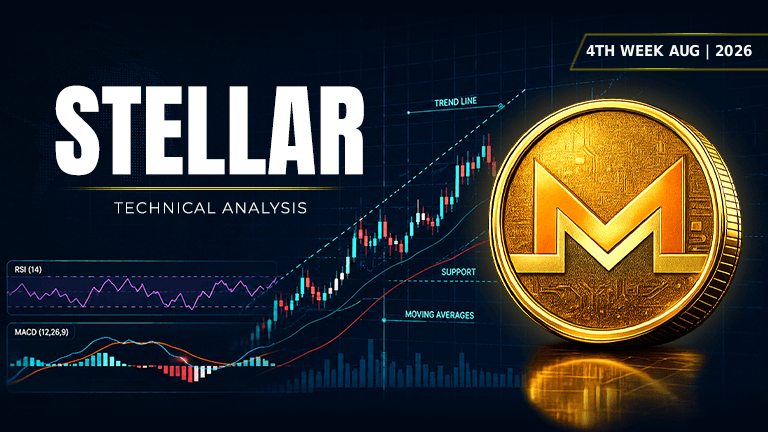
Asset | XMR (XMR/USDT) |
Price at Analysis | $514.34 |
Timeframe | Daily candle |
Date | August 31, 2026 |
Bias | BULLISH |
My Trade | Long: strong momentum with room to run |
Cumulative Score | 7.6 / 10 |
200-day EMA | $359.24, price is above |
Bias Invalidation | Below $403.50 with a daily close: trend is broken |
Overview
Monero XMR price is sitting at $514.34 on the daily chart, trading well above its 200-day moving average of $359.24. The asset has climbed meaningfully from its swing low of $292.09 and is now only $13.17 away from its recent swing high of $527.51. The overall market structure is clean and ascending, with price holding firmly above every major moving average and showing no signs of weakness in the immediate term.
The weight of evidence across the technical landscape is decidedly bullish. Monero price is benefiting from overbought momentum on the RSI, perfect alignment across the exponential moving averages, and a clear absence of overhead resistance to cap the upside. The MACD histogram is expanding positive, on-balance volume is rising, and the ascending trendline at $474.36 is acting as a dynamic floor. This is a market in which the bulls have the advantage, and XMR price action reflects genuine accumulation rather than late-stage exhaustion.
RSI: Overbought but not yet exhausted
The Relative Strength Index is reading 81.4, which places Monero firmly in overbought territory above the 70 level. However, overbought RSI does not mean imminent reversal; it signals strong momentum and conviction among buyers. In an uptrend with no reversal candlesticks on the chart, an RSI this elevated is a sign of structural strength rather than a warning. The fact that RSI has climbed this high while price is still respecting support levels below suggests that buyers have room to continue pushing the market higher.
Score: 8.5 / 10 | Bullish
Moving Averages: Four levels stacked in perfect bullish order
The four exponential moving averages are aligned in textbook bullish fashion. The EMA 20 sits at $438.88, the EMA 50 at $400.94, the EMA 100 at $377.59, and the EMA 200 at $359.24. Price at $514.34 is above all four, and each moving average is positioned progressively lower from left to right, confirming an unbroken uptrend. This is the kind of technical setup that money managers use to justify staying long, and the gap between current price and the 200-day EMA of $359.24 shows that Monero has established a sustainable higher level of value.
Score: 9 / 10 | Bullish
Bollinger Bands: Price riding the upper band with room to extend
The Bollinger Bands show an upper boundary at $496.44, a midline at $432.90, and a lower boundary at $369.37. Current price of $514.34 is above the upper band, indicating that volatility is expanded and momentum is strong. Rather than signaling overbought exhaustion, price trading above the upper Bollinger Band in an uptrend typically suggests that the trend has room to accelerate further. The bands are widening, which means volatility is increasing, and this kind of expansion usually precedes directional moves rather than mean reversions.
Score: 9 / 10 | Bullish
Fibonacci Retracements: Price between key golden ratio levels
The Fibonacci retracement levels are measured from a swing low of $292.09 to a swing high of $527.51. Current price of $514.34 is positioned between the 0.618 level at $437.58 and the 0.786 level at $477.13. This zone sits in the upper half of the Fibonacci spectrum and reflects price action that is deep into a recovery rally. The proximity to the swing high of $527.51 means that Monero is approaching a natural resistance zone, but the fact that price has sustained this height indicates buyer strength.
Score: 9 / 10 | Bullish
Support Levels: Declining zone strength creates execution risk
The primary support levels are identified at $403.50, $386.97, $372.37, and $346.98, spanning a range of more than $56. The nearest support at $403.50 is $110.84 away from current price, which is a meaningful gap. While these levels are real and will provide bounce opportunities if price falls, their distance from current levels means that any reversal would result in a significant drawdown before buyers step in. This is the weakest component of the technical case, because support is well below price and offers traders little margin for error on a short-term position.
Score: 3.5 / 10 | Bearish
Resistance: Clear skies overhead for further upside
No major resistance levels have been identified above current price, which is a powerfully bullish signal in a rising market. The absence of resistance means that price has room to accelerate toward new highs without encountering significant supply zones that could trigger profit-taking. The swing high of $527.51 is the only natural ceiling in the near term, and once that level is broken, price could extend much further. This technical void is exactly what bulls want to see, because it suggests that overhead supply is not a meaningful constraint on further upside.
Score: 8 / 10 | Bullish
Trendline: Ascending support line holding firm
The dominant trendline is ascending and currently positioned at $474.36, which means price is trading $39.98 above it. This ascending trendline is acting as a dynamic floor for the market, and each time price approaches it, buyers have stepped in to defend. The fact that price is holding well above the trendline and moving away from it suggests that the uptrend has structural integrity. Breaking below $474.36 would be a first warning sign that the trend is weakening, but as long as price stays above it, the path of least resistance remains higher.
Score: 8 / 10 | Bullish
MACD: Histogram expanding in positive territory
The MACD line is at 29.225788, the signal line is at 22.747563, and the histogram is at 6.478224, which means the MACD line is above the signal line and the histogram is positive and expanding. This configuration is textbook bullish momentum, indicating that the pace of upward price movement is accelerating. The fact that the histogram is widening rather than narrowing suggests that momentum is not losing steam, and buyers are applying increasing force to the market. MACD is in a regime where momentum traders would be adding to longs, not preparing to exit.
Score: 8.5 / 10 | Bullish
On-Balance Volume: Accumulation trend intact
On-Balance Volume is showing a rising trend, which means that buying volume is outpacing selling volume as price has moved higher. This is the kind of price-volume behavior that confirms a sustainable uptrend, because it shows that buyers are committed to accumulating at these levels. Rising OBV in the context of rising price removes one of the classic warning signs for trend weakness, which is price moving up on declining volume. The fact that OBV is rising gives confidence that Monero's price advance is backed by conviction rather than short covering or trapped bears pushing price.
Score: 7 / 10 | Bullish
Chart Patterns: No clear pattern identified yet
The daily chart shows no identifiable chart pattern at this stage, which means price is in a trending phase rather than a consolidation or reversal pattern. This is neutral from a pattern perspective, because while completed patterns can offer measured targets, trending markets often extend further than pattern-based projections would suggest. In a market with no clear pattern forming, technical traders typically rely on support and resistance levels, moving averages, and momentum indicators rather than pattern geometry.
Score: 5 / 10 | Neutral
Indicator Scorecard
Indicator | Reading | Score / 10 |
|---|---|---|
RSI (14) | Overbought at 81.4, but rising in an uptrend | 8.5 |
EMAs (20 / 50 / 100 / 200) | Perfect bullish alignment, price above all four | 9 |
Bollinger Bands | Price above upper band in expanding volatility | 9 |
Fibonacci | Positioned in upper golden ratio zone | 9 |
Support | Levels too far below to offer security | 3.5 |
Resistance | No overhead supply identified | 8 |
Trendline | Ascending at $474.36, price above and rising | 8 |
MACD | Line above signal, histogram expanding positive | 8.5 |
On-Balance Volume | Rising with price, confirming accumulation | 7 |
Chart Patterns | No clear pattern in formation | 5 |
Cumulative Average | BULLISH bias: I'm going long | 7.6 |
My Trade: Going Long on XMR (Strong momentum with clear setup)
I'm going long here because the cumulative technical score of 7.6 out of 10 is decisively bullish, and Monero XMR price has all the structural hallmarks of a sustainable uptrend. Every major moving average is aligned, momentum is expanding on the MACD, and support below at $403.50 gives me a defined risk zone. My entry zone is between $514 and $520, which captures the current momentum while keeping my risk manageable. I'm targeting three levels above, with the nearest exit at the swing high of $527.51 and more ambitious targets if Monero price continues its tear.
My entry zone | $514.00 – $520.00 |
My stop loss | $401.00 (below first support level) |
My target 1 | $527.51: Swing high |
My target 2 | $545.00: Measured extension above resistance |
My target 3 | $560.00: Fib-based upper target |
Risk : Reward | 1 : 1.6 (T1) / 1 : 3.1 (T3) |
Position | Long / leveraged long |
When I Would Exit
I would exit this trade immediately if Monero XMR price closes below $403.50 on a daily candle, because that level marks the top support tier and a break below it would signal that the uptrend has lost structural integrity. If price falls through $403.50 and closes below it with conviction, the entire bullish narrative is invalidated, and I would either take my stop loss or flip to a short bias depending on what the next candles show. My thesis assumes that Monero will respect this first support zone, and if it doesn't, then either the strength I'm seeing is illusory or a larger correction is underway that changes the risk-reward equation entirely.
Disclaimer: This article is produced for informational and educational purposes only and does not constitute financial or investment advice. Cryptocurrency markets are highly volatile and carry significant risk. Always conduct your own research and consult a qualified financial adviser before making any trading decisions.

Pratik Oswal
An Electronics and Telecommunication Engineer with a strong foundation in analytical and quantitative thinking. I have authored seven books on Mathematics and have been actively involved in trading since 2012. Since 2017, I have been deeply engaged in the crypto ecosystem, gaining extensive experience across digital assets, markets, and emerging blockchain technologies. My background combines technical expertise, mathematical proficiency, and over a decade of hands-on experience in financial markets.
More from PratikNext up

Chainlink LINK price stuck in neutral: should you wait or move on?
Chainlink shows conflicting signals as bulls and bears battle for control over the next week.
 LINK
LINK
Monero Futures Open Interest Tops $300M as XMR Holds Above $600
 XMR
XMR
Zcash Jumps 12% as NU7 Upgrade Gets Activation Target
 ZEC
ZEC
3 Altcoins to Watch in October’s Third Week 2026: AKE Unlock, Quack AI Futures and Monero's $600 Test
XMR
Zcash Sheds 16% in a Week as $17.8M of Longs Are Flushed
ZEC BTC
BTC