XRP, XLM, DOGE and NEAR Price Analysis for September 10: Can Altcoins Regain Momentum?
XRP, Stellar, Dogecoin and NEAR are attempting to extend their September recoveries, but key resistance levels could determine whether the altcoins regain stronger momentum.

By Bikash DekaAuthor
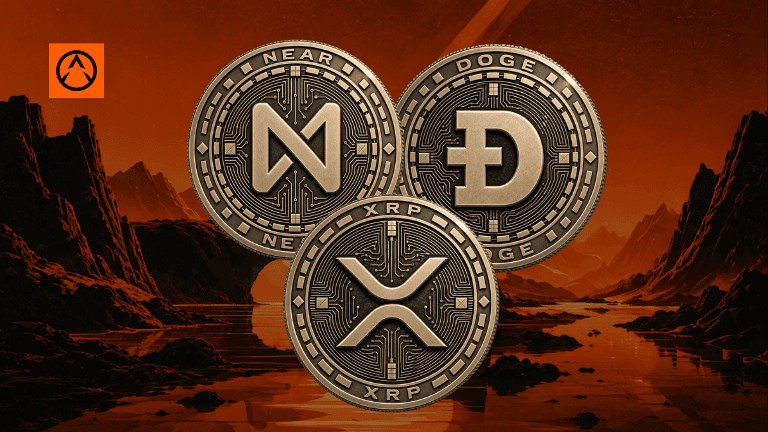
The altcoin market is attempting to extend its recent recovery, but the next move for XRP, Stellar (XLM), Dogecoin (DOGE), and Near Protocol (NEAR) could depend on how each token handles key resistance levels.
XRP and DOGE are approaching important long-term moving averages, XLM is testing its 200-day EMA, while NEAR has already broken decisively higher but is showing signs of stretched momentum. The setups therefore remain constructive overall, but the resistance zones ahead could determine whether the current recovery develops into a broader trend.
XRP Price Analysis: Can Bulls Break $1.55?
XRP remains in consolidation after its powerful August breakout. The token is currently trading around $1.42 and remains comfortably above its major moving averages, keeping the broader recovery structure intact.
The most important support zone is now $1.33 - $1.36. XRP's 200-day EMA sits near $1.36, while the rising 20-day EMA is around $1.34. XRP broke above the 200-day EMA during its August rally and has since used the area as support.
A daily close below $1.33 - $1.36 would weaken the current structure and expose the $1.24 area around the 100-day EMA. The 50-day EMA sits considerably lower near $1.20, making it a deeper support level if the correction accelerates.

On the upside, XRP first needs to clear $1.45 - $1.47, followed by the more important $1.50 - $1.55 resistance zone. A sustained move above $1.55 would reopen the path toward the August high near $1.70.
The RSI is around 61, indicating positive momentum without suggesting that XRP is overbought. That leaves room for another move higher if buyers return.
Related: XRP Price at a Crossroads: Can Bulls Break $1.55?
Stellar Price Analysis: Can XLM Reclaim $0.19?
Stellar's recovery remains less convincing than XRP's. XLM is trading around $0.188, just below its 200-day EMA near $0.189.
Unlike XRP, Stellar has not yet secured a decisive breakout above this long-term trend indicator. However, the structure underneath the current price is improving.
The 20-day EMA is around $0.181, while the 50-day and 100-day EMAs are approximately $0.175 and $0.180, respectively. This creates a relatively strong support cluster beneath the current price.

The immediate test is therefore $0.189 - $0.190. A sustained break above that zone would strengthen the recovery and put $0.20 back in focus. Above $0.20, XLM could target the $0.21 - $0.22 region, which previously acted as an important reaction zone.
The bearish scenario would begin with a loss of $0.180. A deeper move below $0.175 would damage the short-term bullish structure and potentially send XLM toward $0.16.
With an RSI near 56, XLM remains in neutral-to-bullish territory. Unlike some recent altcoin rallies, the token is not yet showing an overbought reading, meaning a breakout above the 200-day EMA could still attract additional momentum.
Dogecoin Price Analysis: $0.095 Is the Key Level
Dogecoin is attempting to establish a sustainable recovery after spending much of the summer under pressure. DOGE has rebounded from its August low near $0.070 and is currently trading around $0.090.
The immediate obstacle is the 200-day EMA near $0.094. DOGE has already tested this level twice during the recovery but has failed to establish a convincing daily close above it.
That makes $0.094 - $0.095 the most important resistance zone for DOGE. A successful breakout would put $0.10 back in focus, followed by $0.105 - $0.110, an area that previously acted as both support and resistance.
Reclaiming that zone would significantly improve Dogecoin's medium-term technical structure.

The support picture has also improved. The 20-day EMA is around $0.084, the 100-day EMA is near $0.083, and the 50-day EMA sits around $0.078. Losing the $0.082 - $0.084 region would weaken the recovery and could expose $0.075.
DOGE's RSI is around 61.5, showing positive momentum without reaching overbought territory. The setup therefore remains constructive, but bulls need to clear $0.094 - $0.095 before the recovery can develop into a stronger trend reversal.
NEAR Price Analysis: Can the Rally Reach $3?
NEAR has the strongest setup of the four tokens, but it also carries the greatest short-term momentum risk.
The token has extended a rally that began around $1.60 in August, gaining roughly 13% in a single day to reach $2.62. The move pushed NEAR decisively above its major moving averages.
The 50-day, 100-day and 200-day moving averages remain clustered around $1.83 - $1.87, while the 20-day EMA has climbed to approximately $2.03. This area now forms an important medium-term support zone.

The immediate challenge is $2.60 - $2.65. A clean breakout above that range could open the way toward $2.80, followed by the $3.00 - $3.10 area corresponding to the May - June highs.
However, NEAR's momentum is becoming stretched. The daily RSI is around 75, placing the token firmly in overbought territory.
That does not automatically mean a reversal is coming. Strong breakouts can remain overbought for extended periods. But after a roughly 60% rally from the August low, the probability of short-term profit-taking has increased.
The first support area is around $2.40 - $2.45. A deeper correction could bring $2.20 into play, while the rapidly rising 20-day EMA near $2.03 represents a more important medium-term support level.
For bulls, the ideal scenario would be a period of consolidation around current levels before another attempt at $2.65. That would allow momentum to cool without necessarily damaging the broader breakout.
XRP, XLM, DOGE and NEAR Face Different Tests
The four altcoins are at different stages of their recoveries.
XRP has already established a major breakout and is now consolidating above long-term support. Its next major test is the $1.45 - $1.55 resistance zone.
XLM is still trying to confirm its breakout, with the $0.189 - $0.190 area representing the key hurdle. DOGE is in a similar position, with $0.094 - $0.095 separating its current rebound from a more meaningful trend reversal.
NEAR is further ahead after its sharp breakout, but its RSI near 75 means traders should watch for profit-taking or consolidation before assuming the rally can continue uninterrupted.
XRP and DOGE need to clear major resistance, XLM needs to reclaim its 200-day EMA, while NEAR needs to absorb its recent gains without losing its breakout structure.
For traders watching the September recovery, these levels could determine whether the current bounce develops into another leg higher or fades into another round of consolidation.
Related: HYPE, ZEC, ETH and SHIB Face Key September Levels as Volatility Cools

Bikash Deka
Bikash Deka is a crypto and Web3 analyst and writer focused on making blockchain, cryptocurrency, and digital asset developments easier to understand. His work covers crypto markets, emerging blockchain projects, industry trends, and major developments across the digital asset ecosystem. With a background in Technology and Web3, Bikash combines analytical research with clear, beginner-friendly writing. He follows market movements, evaluates industry developments, and turns complex crypto topics into accessible insights for readers. At Altcoin Buzz, Bikash contributes research driven news and educational content designed to help readers better understand what is happening in the fast-moving world of cryptocurrency and blockchain.
More from BikashNext up

Longs Take 83% of $333M Crypto Liquidations as Bitcoin Holds $81K
CoinGlass data shows $332.79M in 24h crypto liquidations, 83.4% from longs, with ETH ahead of BTC and the biggest single wipeout on a tokenised SOXL market.
 BTC
BTC SOL
SOLRelated
More in Crypto NewsRelated
Bitcoin Drops Below $80K as Crypto Liquidations Top $834M
BTC ETH
ETH
DFINITY Founder Accuses NEAR of Using ICP Signing Research
 NEAR
NEAR ICP
ICP
XRP Sits Right at Its $1.36 Ceiling: Will Rises Stop There Again?
 XRP
XRP
Ethereum Staking Hits Record 43.8M ETH as Yields Fall Again
ETHSOL