


")


 Tokens Playing This P2E Game")


It looks like Bitcoin is holding pretty strong above the $7500 level, but is this a bullish sign or will we end up breaking the consolidation area bearish? It’s hard to say, however, let’s have a look at what the charts indicate.
Coinbase – BTC/USD Short-Term Chart Analysis
- Current Price on CoinGecko at the moment of writing this article: $8000
- Resistance levels: $8,100, $9,100, $10,000
- Support levels: $7,500, $6,500, $6,200
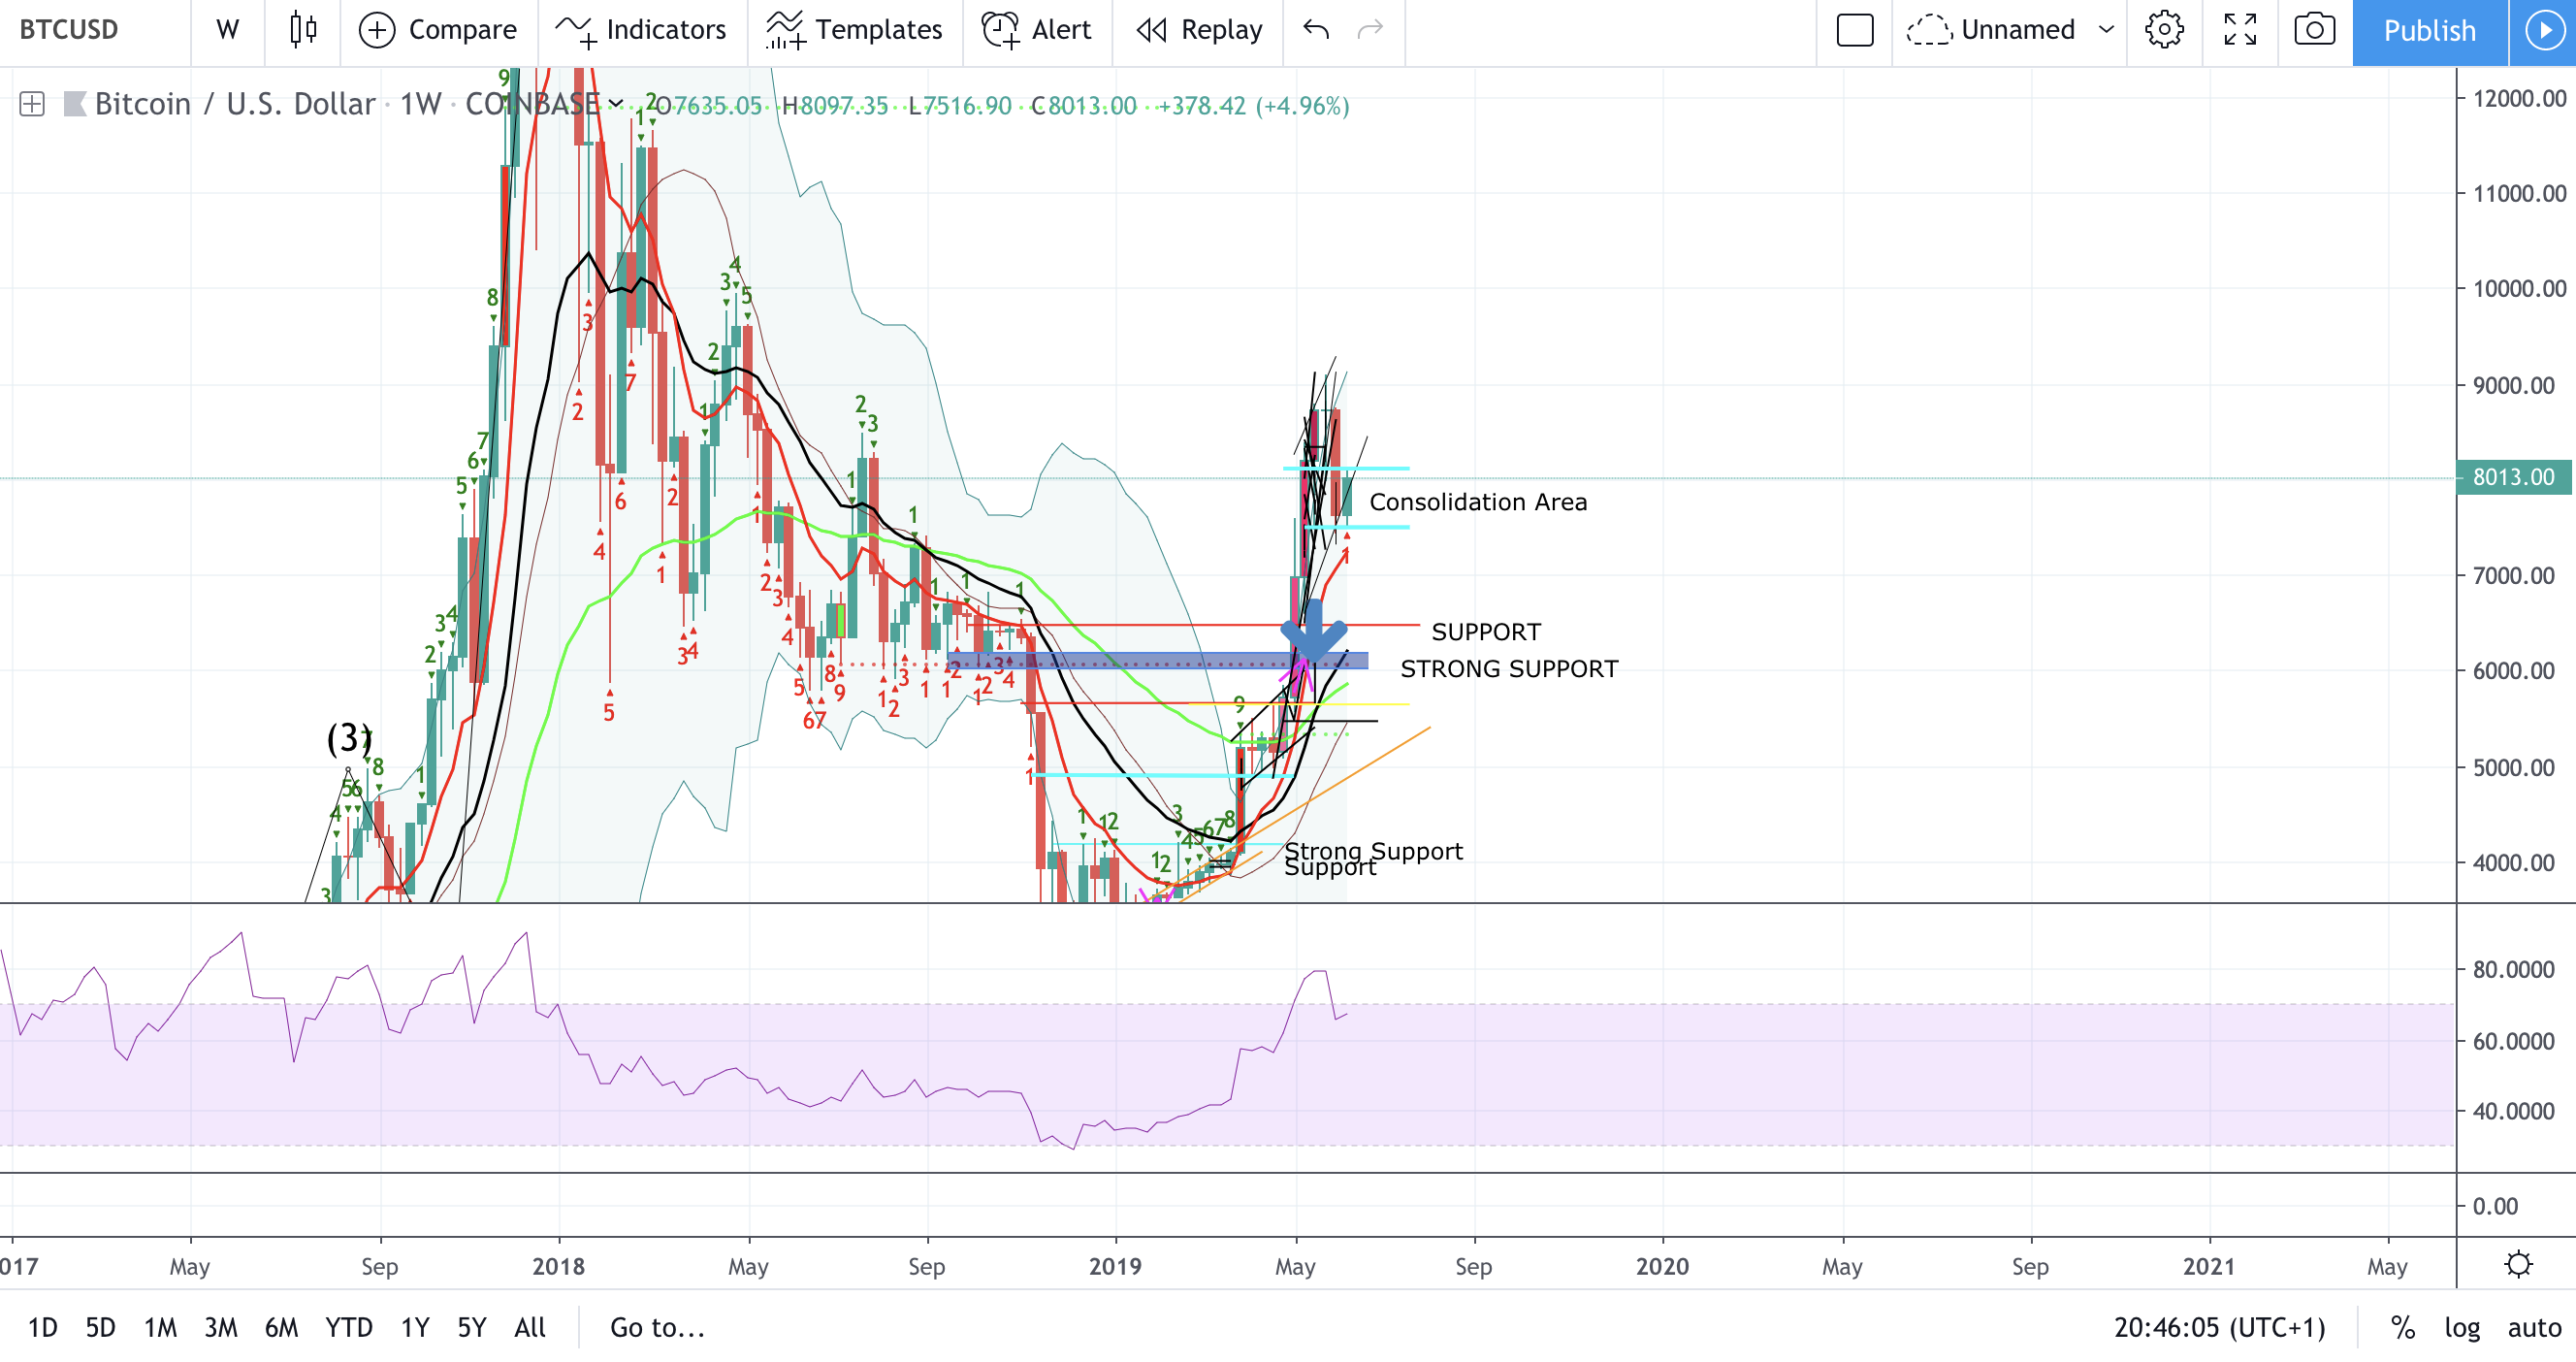
By looking at the weekly chart, we can see the TD count indicating a correction should come. Other than that, we can see on the RSI indicator that the price is trying to get back into the oversold area.
It’s perfectly normal for the price to be bouncing off the oversold area and then to recover after a small retracement during bull runs, however, I don’t feel like we have had enough of a retracement just yet.
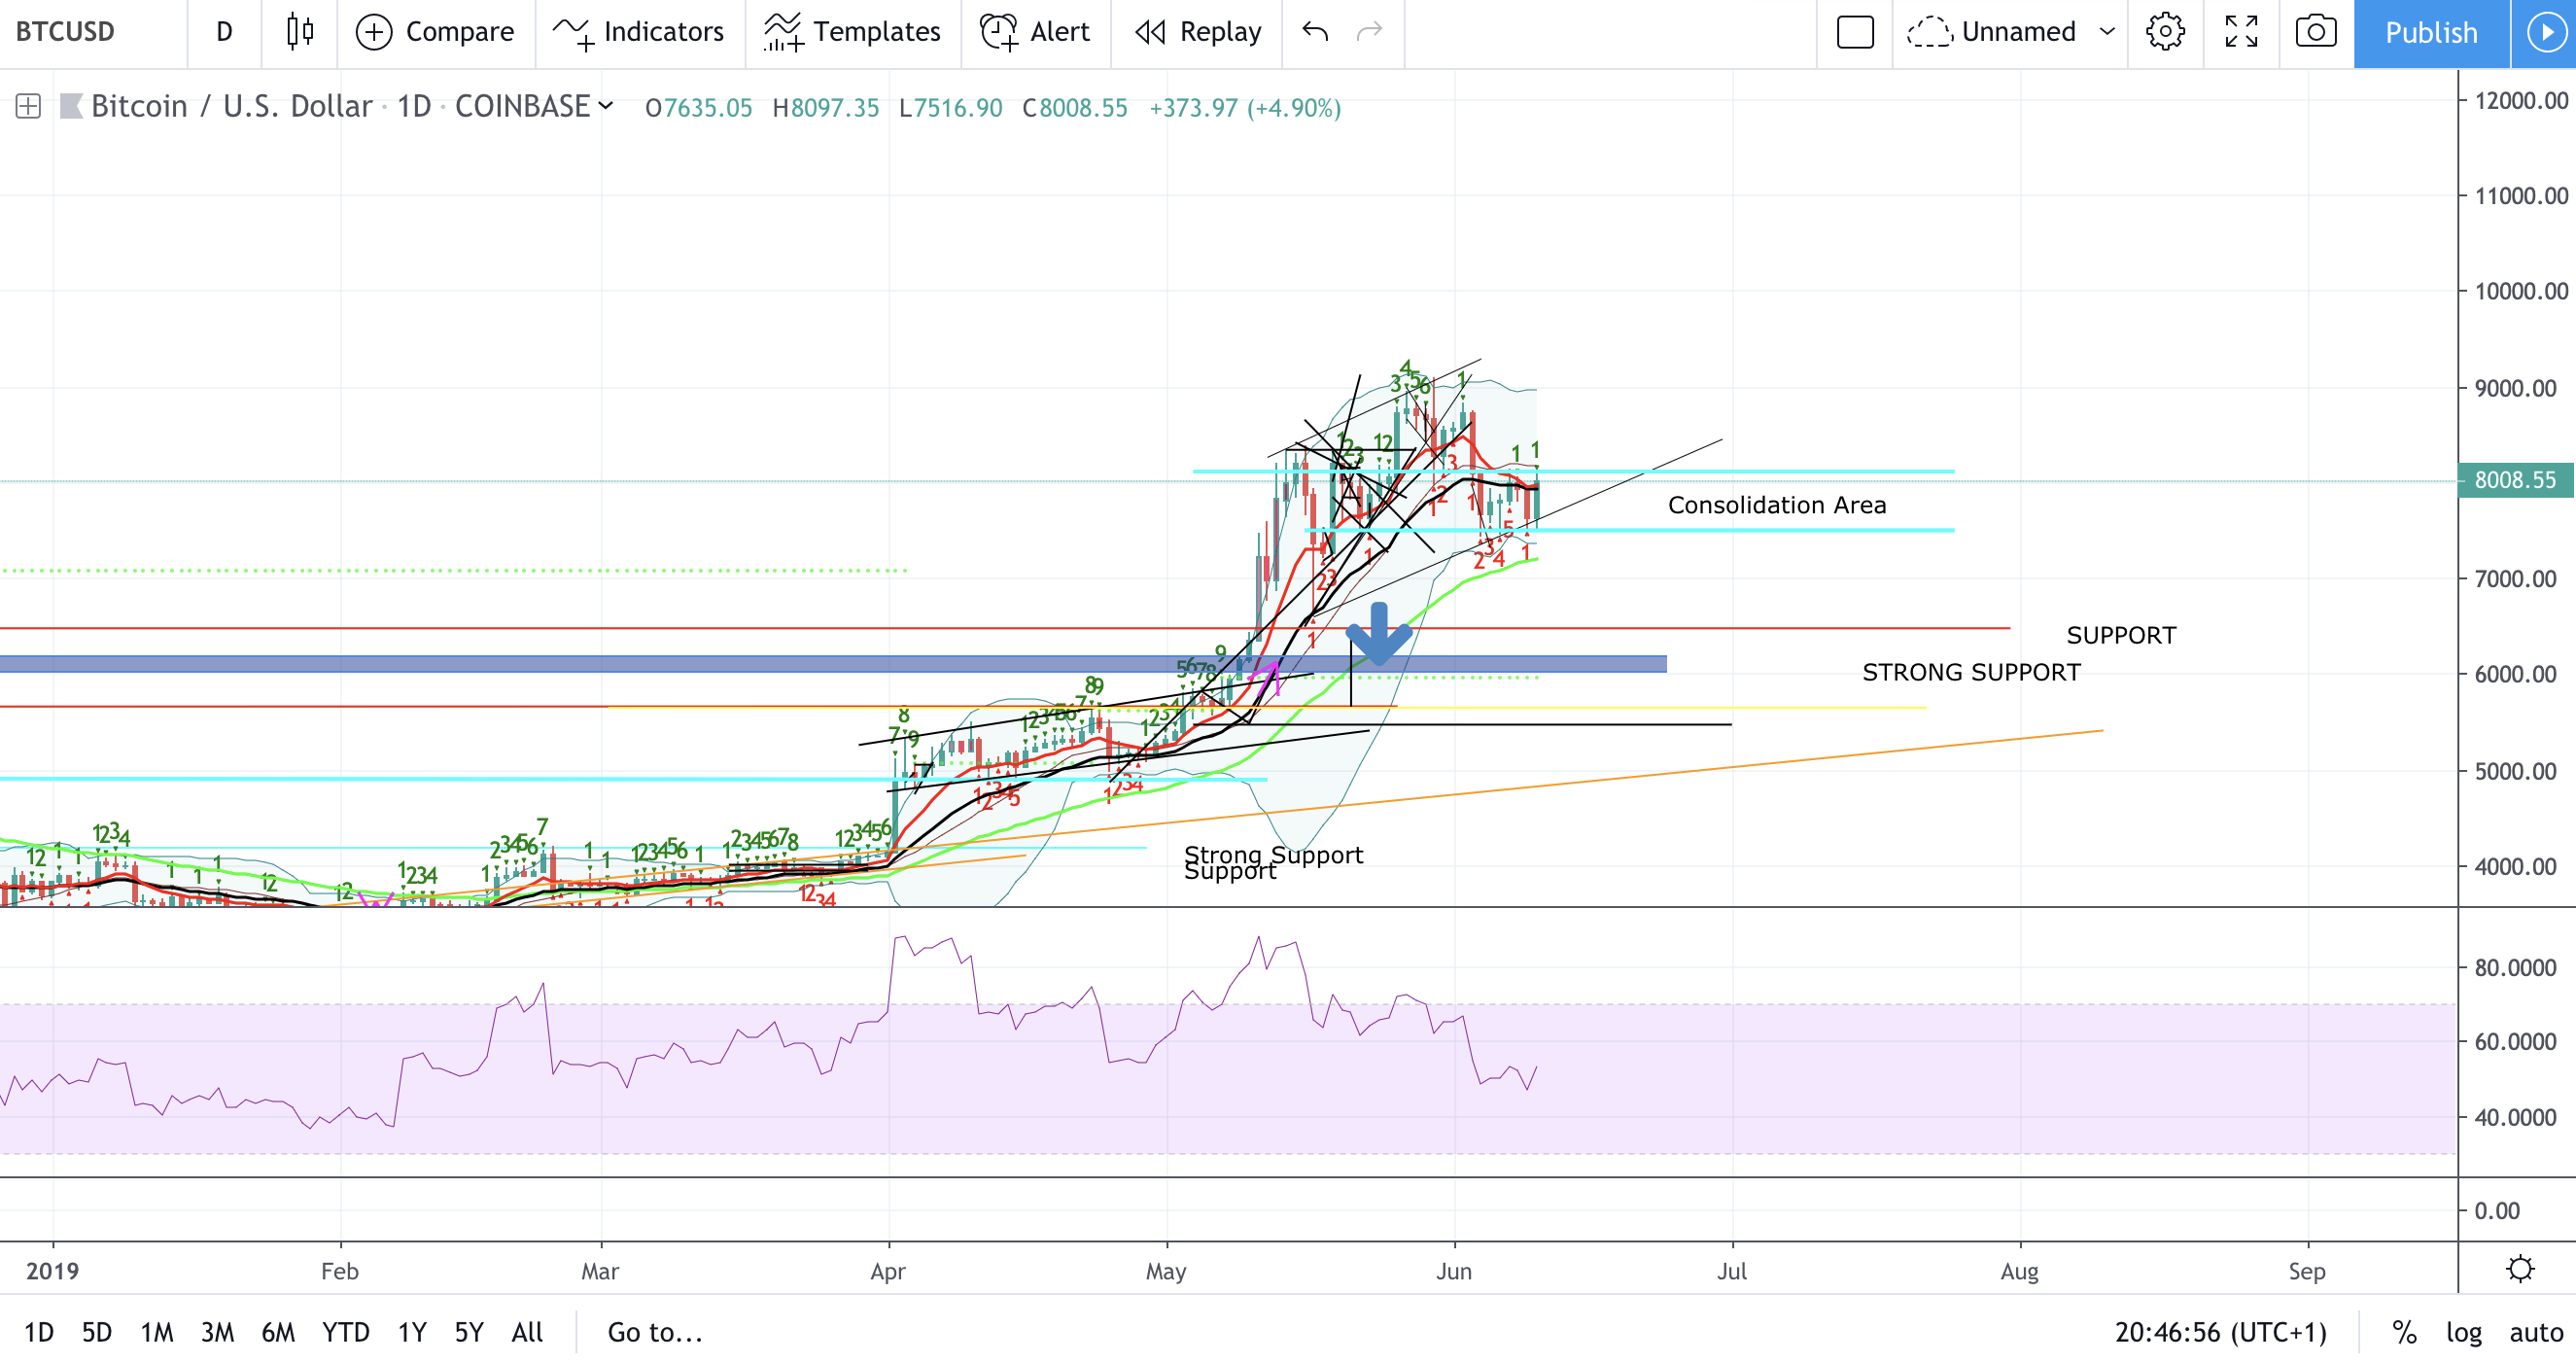
Moving on to the daily chart, we can have a better look at the consolidation area. Bitcoin is having a hard time breaking $8,100. We can also see a bull EMA cross that may close today, and to be honest, it’s possible that we might end up with a fake breakout.
I believe that if we break past $8,100 we might go for $10,000 or higher, however, if we break below $7,500, we’ll see $6,500 or lower.
Another possible scenario is a longer consolidation between $7,500-8,100 which will be a strong bull signal for me.
In conclusion, I will remain cautious, but there is definitely room for higher highs.
You need help to understand all the technical analysis and trading terms? Click here.
Note: I am just expressing my own opinion in this article. This is not financial advice. Please, do your own due diligence before investing.


