


")


 Tokens Playing This P2E Game")
")
A dramatic turn of events dominated last week’s headlines. Ether tumbled down and erased all of its gains following the much-anticipated Shanghai upgrade. Adding to the surprise, Bitcoin also experienced a sudden reversal, losing its hold on the $30,000 mark, and instead being exchanged at roughly $27,400. Let’s dive in!
1) Macro Scene
Bitcoin and altcoins experienced a positive correction after a recent rally sparked speculation of a new bull market.
Despite some short-term challenges, such as the impending lawsuit against Coinbase following the SEC’s issuance of a Wells Notice, the passing of the MiCA bill by the European Union signals a favorable regulatory environment for the future. It will likely lead to more significant institutional investment in the space.
The EU is now the first major jurisdiction in the world to introduce a comprehensive crypto law.
Lawmakers voted 517-38 on Thursday in favor of a new crypto licensing regime, MiCA, with 18 abstentions. https://t.co/6Bzna8Bf36 pic.twitter.com/QTuvUQUzZl
— CoinDesk (@CoinDesk) April 20, 2023
Besides, Coinbase will soon launch its offshore exchange, with the lawsuit looming. However, there may be some hope for Coinbase to avoid litigation, given that Paxos received a Wells Notice more than two months ago and the SEC has yet to sue it.
Unfortunately, the regulatory pressure isn’t solely on centralized exchanges like Coinbase. DeFi protocols are also in the crosshairs.
So, How are Protocols Reacting?
Unsurprisingly, many protocols consider governance proposals related to KYC/AML to address these concerns. Although regulatory bodies cannot force decentralized protocols to comply, they may focus on the centralized components of these protocols, such as stablecoins.
MakerDAO, for example, has transferred a significant portion of its USDC backing DAI to Coinbase in search of yield, making it a potential target for regulators. Notably, NFTs have stood out in the crypto industry, but even this sector is now feeling the heat. We could attribute this scenario to NFT-based borrowing and potential liquidations or concerns that NFT-related DeFi protocols will face regulatory scrutiny.
On a macro level, US regulators are bracing for a potential credit event in the non-bank sector. The proposed rules, from the FSOC, would grant regulators the power to declare non-bank entities as systemically important. This could lead to bailouts similar to those seen with Silicon Valley Bank and Signature Bank.
But the most concerning aspect is that this rule would also give regulators significant control over the crypto industry, allowing them to designate and potentially sell companies like Coinbase or Circle to big banks.
Besides, the situation in Ukraine is also worth monitoring as spring approaches and experts expect fighting to intensify. Additionally, tensions between the US and China continue to escalate, with the risk of a conflict over Taiwan increasing. Moreover, EU President Ursula Von Der Leyen’s recent tweet implies that the China-Taiwan situation may now be more critical than the Russia-Ukraine conflict.
Very good exchange with @POTUS Biden on strategic matters for EU-US, including:
– relations with China, need for peace & stability across the Taiwan Strait
– support to Ukraine against Russia’s illegal invasion
– preparation of G7 summit in Hiroshima
– developments in Maghreb— Ursula von der Leyen (@vonderleyen) April 20, 2023
2) Declining Bitcoin – Ether Correlation
Coinbase’s recent report states that the correlation between bitcoin (BTC) and ether (ETH) has been declining since the beginning of 2023, with the difference widening after the Shapella hard fork on Ethereum.
The correlation, measured by a 40-day rolling window, has dropped from 0.95 to 0.82. In the past, these two crypto assets have moved primarily in sync.
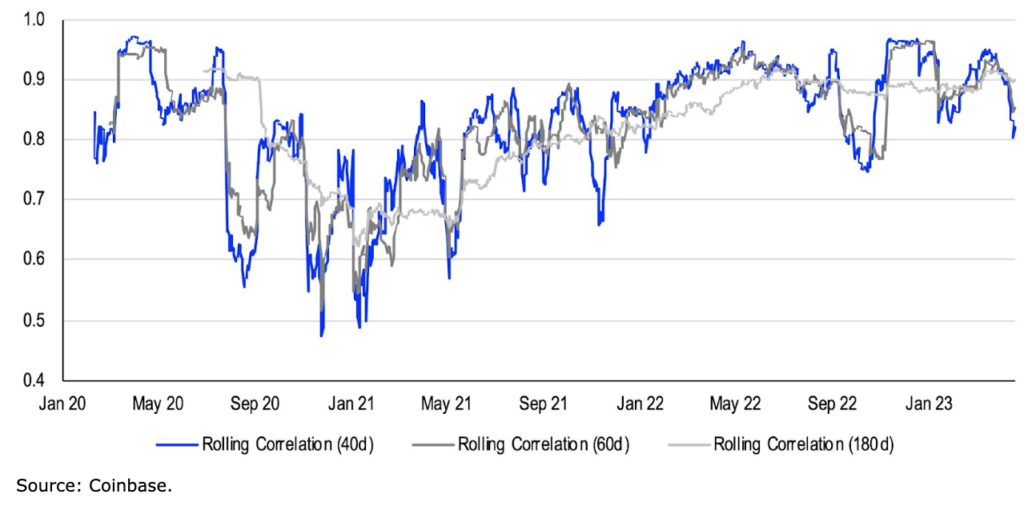
Source: Coinbase
Interestingly, the decline in correlation has become more noticeable following the successful completion of the Shanghai upgrade on April 12 2023, which allows validators to withdraw staked ether. Moreover, we can observe a similar trend after the Merge update in September 2022.
Nonetheless, the lower BTC-ETH correlation could affect portfolio diversification and risk management. This will lead institutional investors to modify their hedging strategies. Holding both BTC and ETH could potentially provide more benefits than keeping either one alone. This could reduce overall volatility and increase potential portfolio returns.
However, correlation is not a fixed measure and could change over time, depending on market conditions and network developments in BTC and ETH.
3) Analyzing the Volume Trends
When we zoom out and examine the aggregated volumes, we see that the crypto volumes appear encouraging. Especially when grouped by quarter. Moreover, the second quarter of 2023 was the second-highest volume ever, which is remarkable considering it occurred during a bear market.
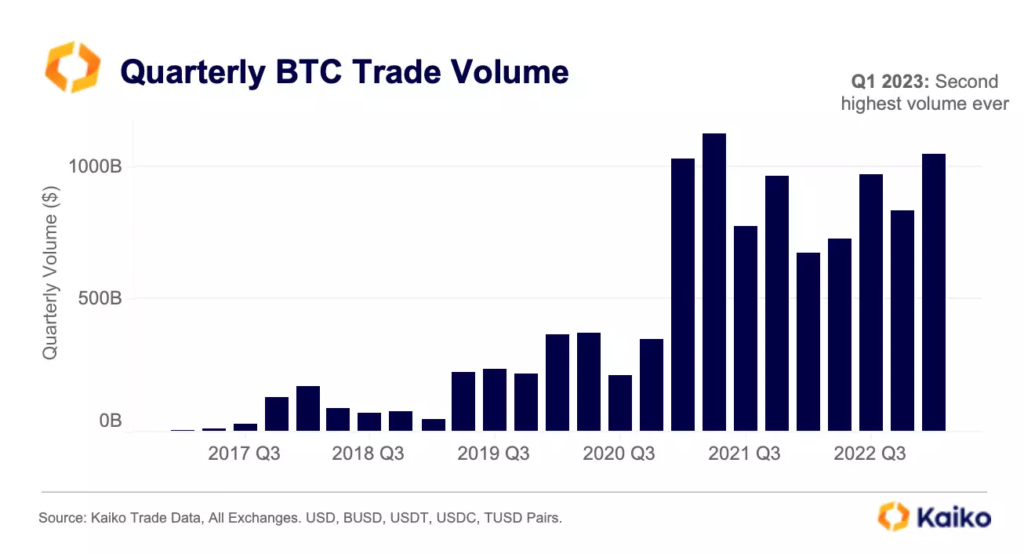
Source: Kaiko
During this quarter, a safe haven narrative circulating among BTC investors due to the ongoing banking crisis buoyed the volumes. It is noteworthy that BTC hit almost record high volumes during both a bear market and a banking crisis, and this happened as the SEC was tightening its grip on the crypto industry.
Source: Kaiko
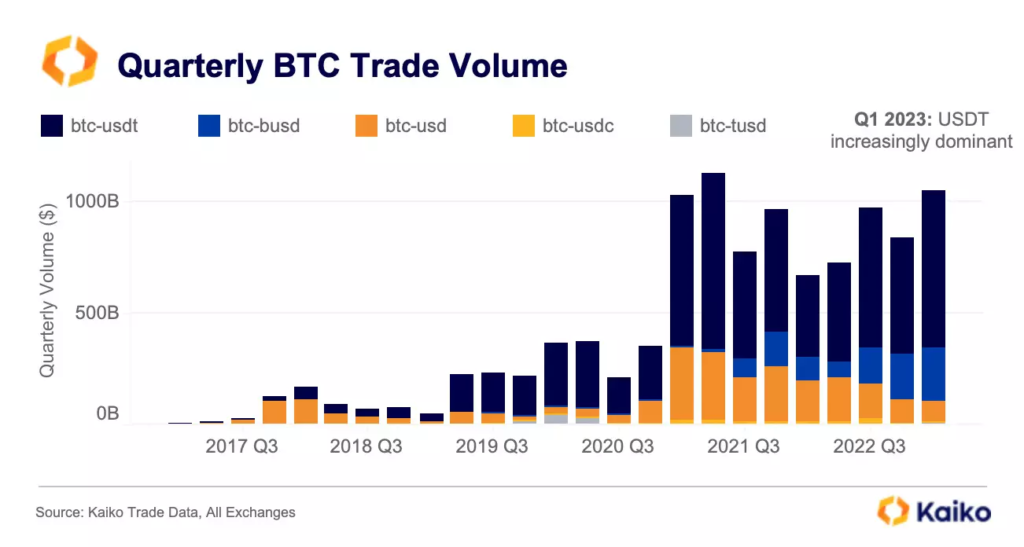
So, examining BTC trading volumes per pair can provide a deeper understanding of volume dynamics. Over the past year, the USDT and BUSD pairs have experienced the most significant increase in trading volume share.
Notably, these pairs are Binance’s two most prominent stablecoin trading pairs and have benefitted from the exchange’s zero-fee program for the last seven months. Undoubtedly, Binance has had a significant impact on trading volumes.
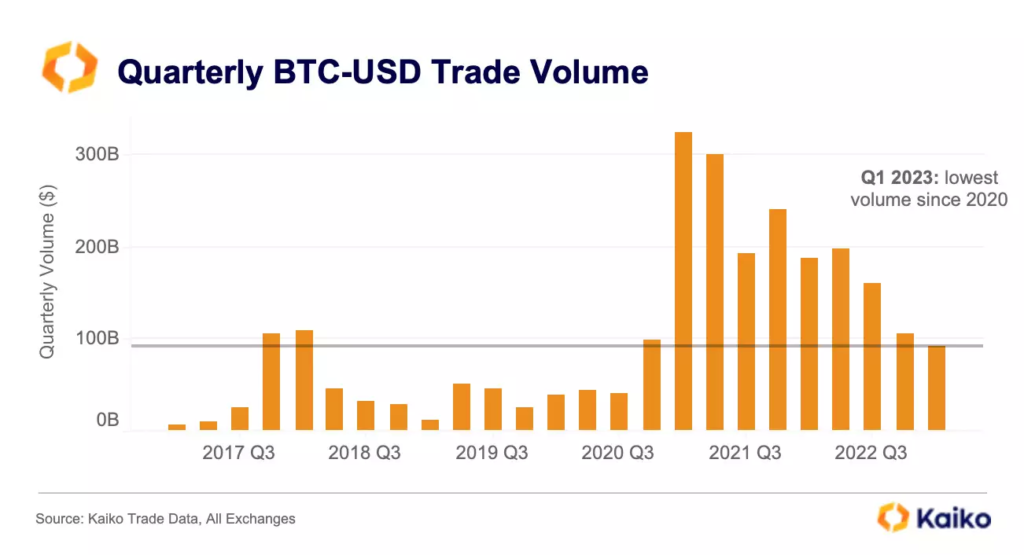
Source: Kaiko
The dominance of BUSD and USDT, over the past few years, has come at the expense of USD, as crypto investors become less reliant on fiat pairs. This trend is apparent when we zoom in and analyze BTC-USD volumes per quarter, which contrasts sharply with the overall quarterly volume trend.
However, It’s not surprising that the USD volumes are low. Due to the banking crisis and regulatory enforcement, most crypto firms have been cut off from all USD payment rails. And only larger firms have been able to secure new banking partners.
So, it has resulted in lower liquidity on USD pairs, as market makers are less inclined to offer liquidity on less efficient pairs for their operations.
4) The Market Structure
Bitcoin has recently experienced a correction of around 10% after rallying almost 100% in early 2023. Technically speaking, BTC passed a crucial inflexion point at the start of the year, where the ascending and descending trend lines intersected (marked in black).
This point is significant because it represents a technical watershed that defines the market’s trajectory from 2021 until the halving year of 2024.
Moreover, in early 2023, BTC exceeded the realized price indicator (grey), representing the average price of all Bitcoin purchases. It is also a vital milestone, as it indicates that the average Bitcoin buyer is profiting from their investment.
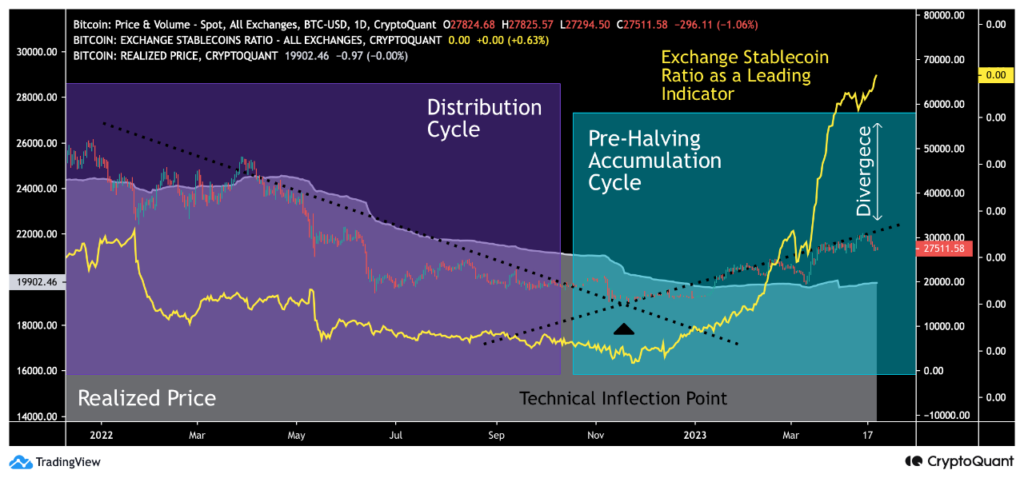
Source: CryptoQuant
So what is the Bigger Picture, then?
We can divide BTC’s market behavior into two main phases: accumulation (turquoise) and distribution (purple), forming a series of multi-year cycles. Interestingly, Institutional money tends to favor accumulation cycles, while retail investors are more active during distribution cycles. Moreover, halving events always preceded by pre-halving accumulation cycles (turquoise) also characterize Bitcoin’s history.
In conclusion, several technical and on-chain factors still support Bitcoin’s market structure. The multi-year inflexion point backs Bitcoin technically, and it is also supported by the realized price, growing ESR divergence, and pre-halving accumulation cycle.
⬆️ For more cryptocurrency news, check out the Altcoin Buzz YouTube channel.
⬆️ Our popular Altcoin Buzz Access group generates tons of alpha for our subscribers. And for a limited time, it’s Free. Click the link and join the conversation today.
")

