


")


 Tokens Playing This P2E Game")
_opt")
The current situation in the Crypto Space is quite crazy and the markets don’t move as expected. For me, it’s obvious that a Bull Run has started, however, I’d still be cautious since the price can’t only go up. I’d expect a major correction soon but, until then…
ETH/USD Short-Term Chart Analysis
- Support: $165
- Resistance: $195, $210
- Current Price on CoinGecko: $178
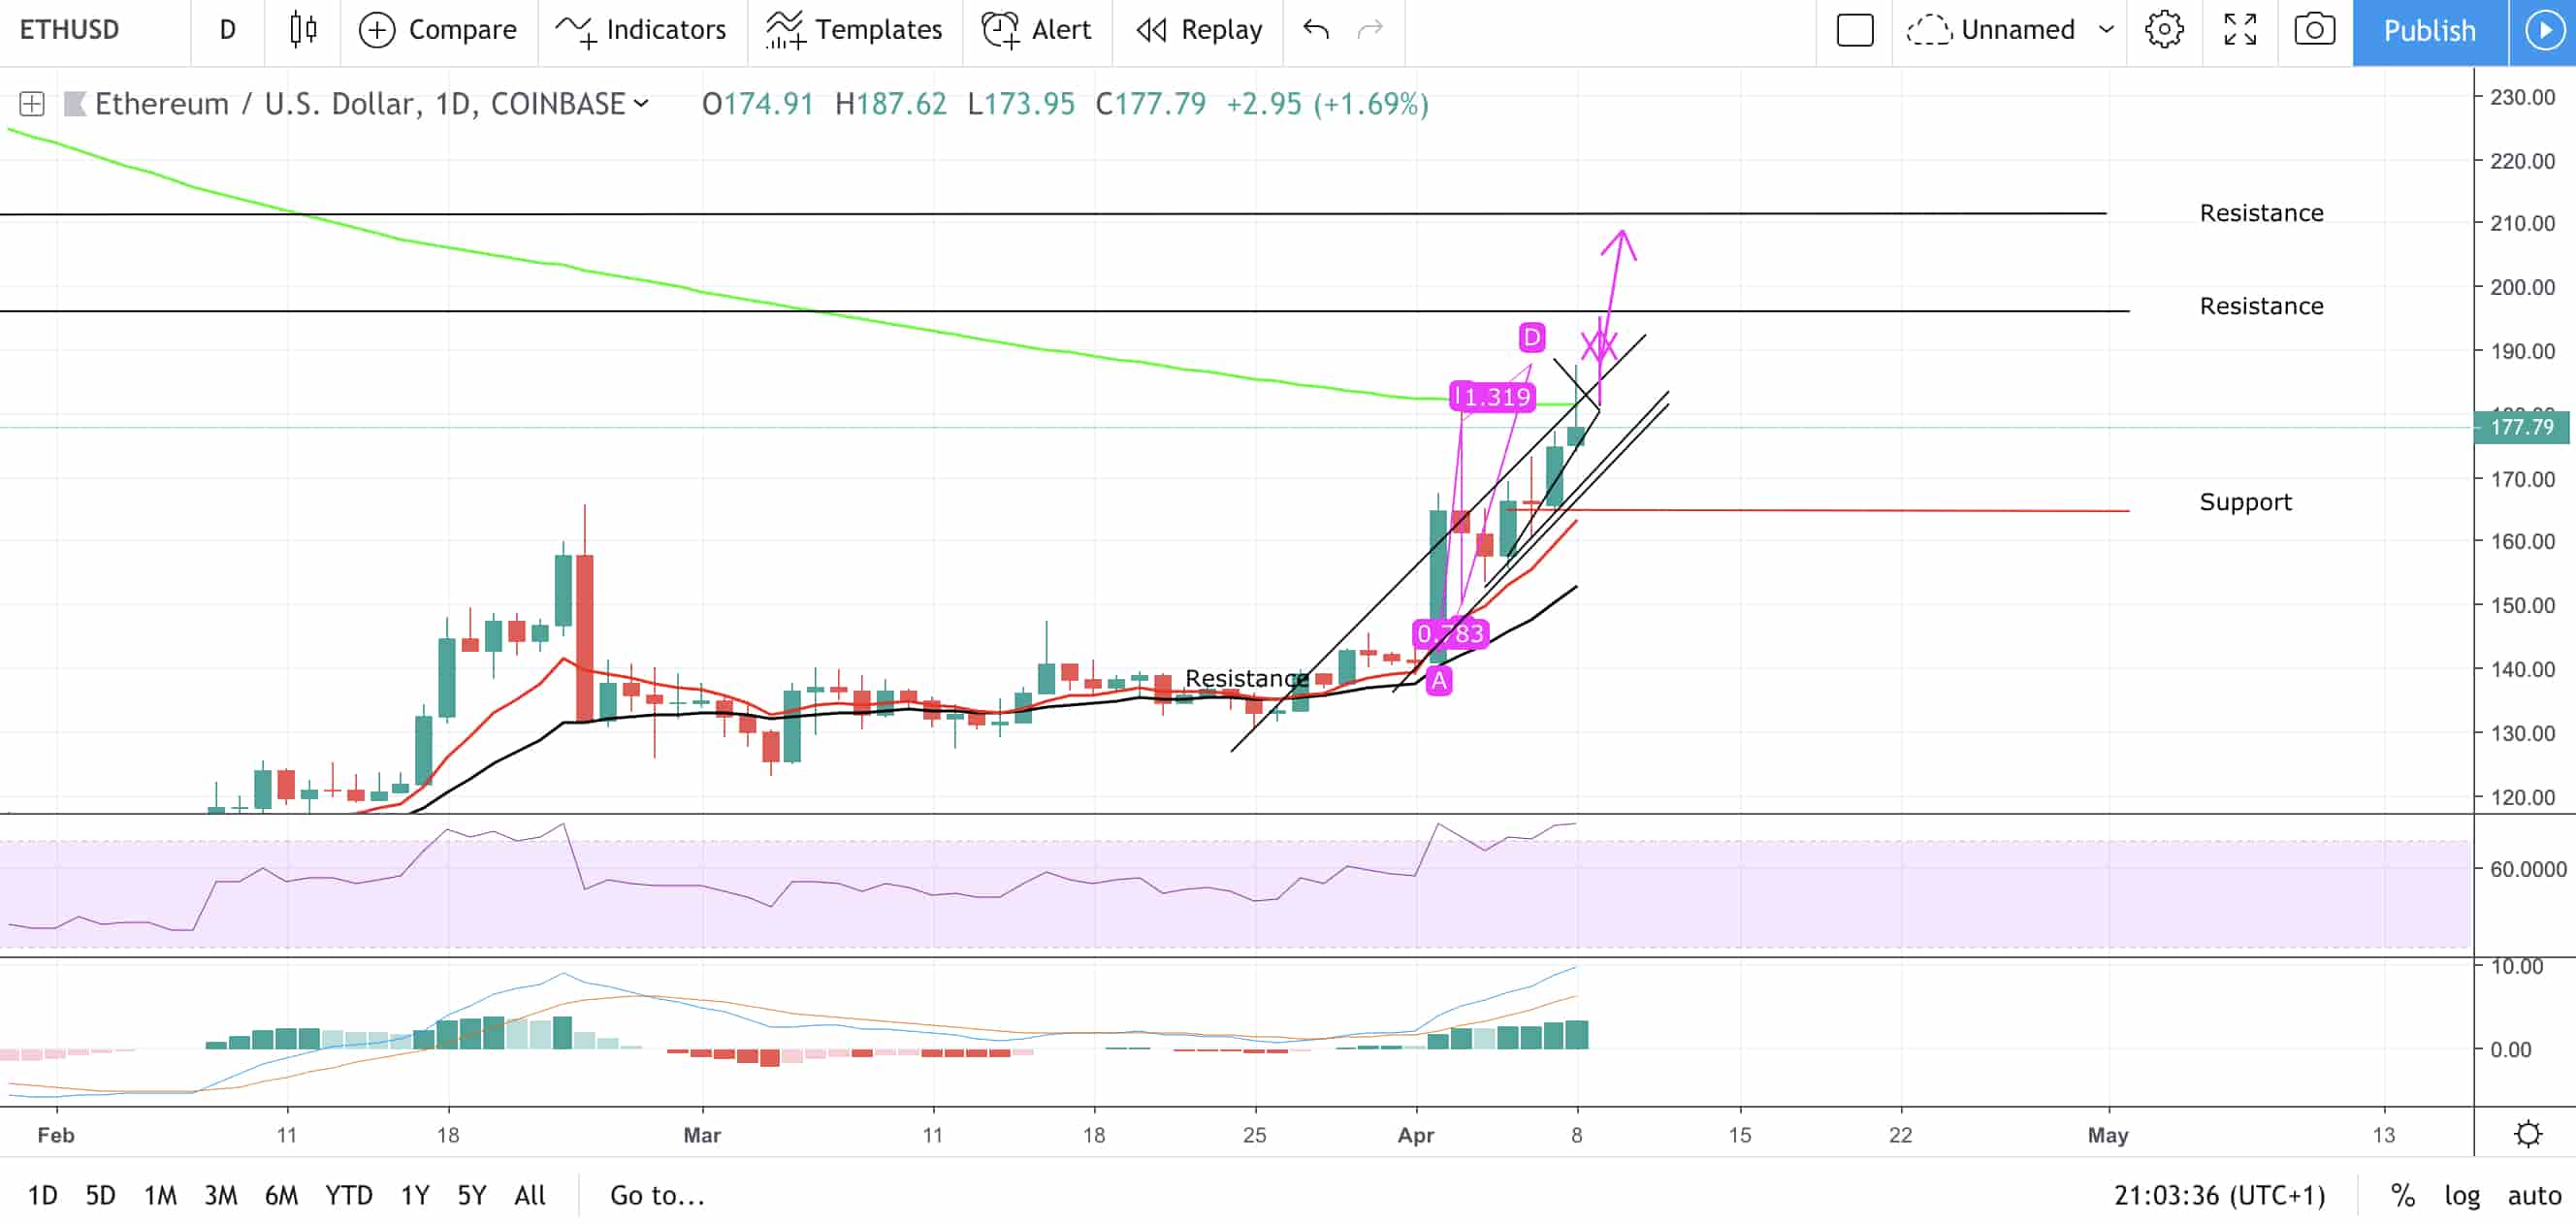
Looking at the daily chart of ETH, we can see that it is currently being rejected by the 200 EMA(green), forming a bearish hammer and showing up as overbought on the RSI indicator. In conclusion, it looks bearish on the daily chart, but nothing to worry about yet since there are a few hours left.
I think it’s about how the daily candle closes unless Bitcoin goes to the $5400 area(after that, I’d expect the correction I have talked about in my previous article).
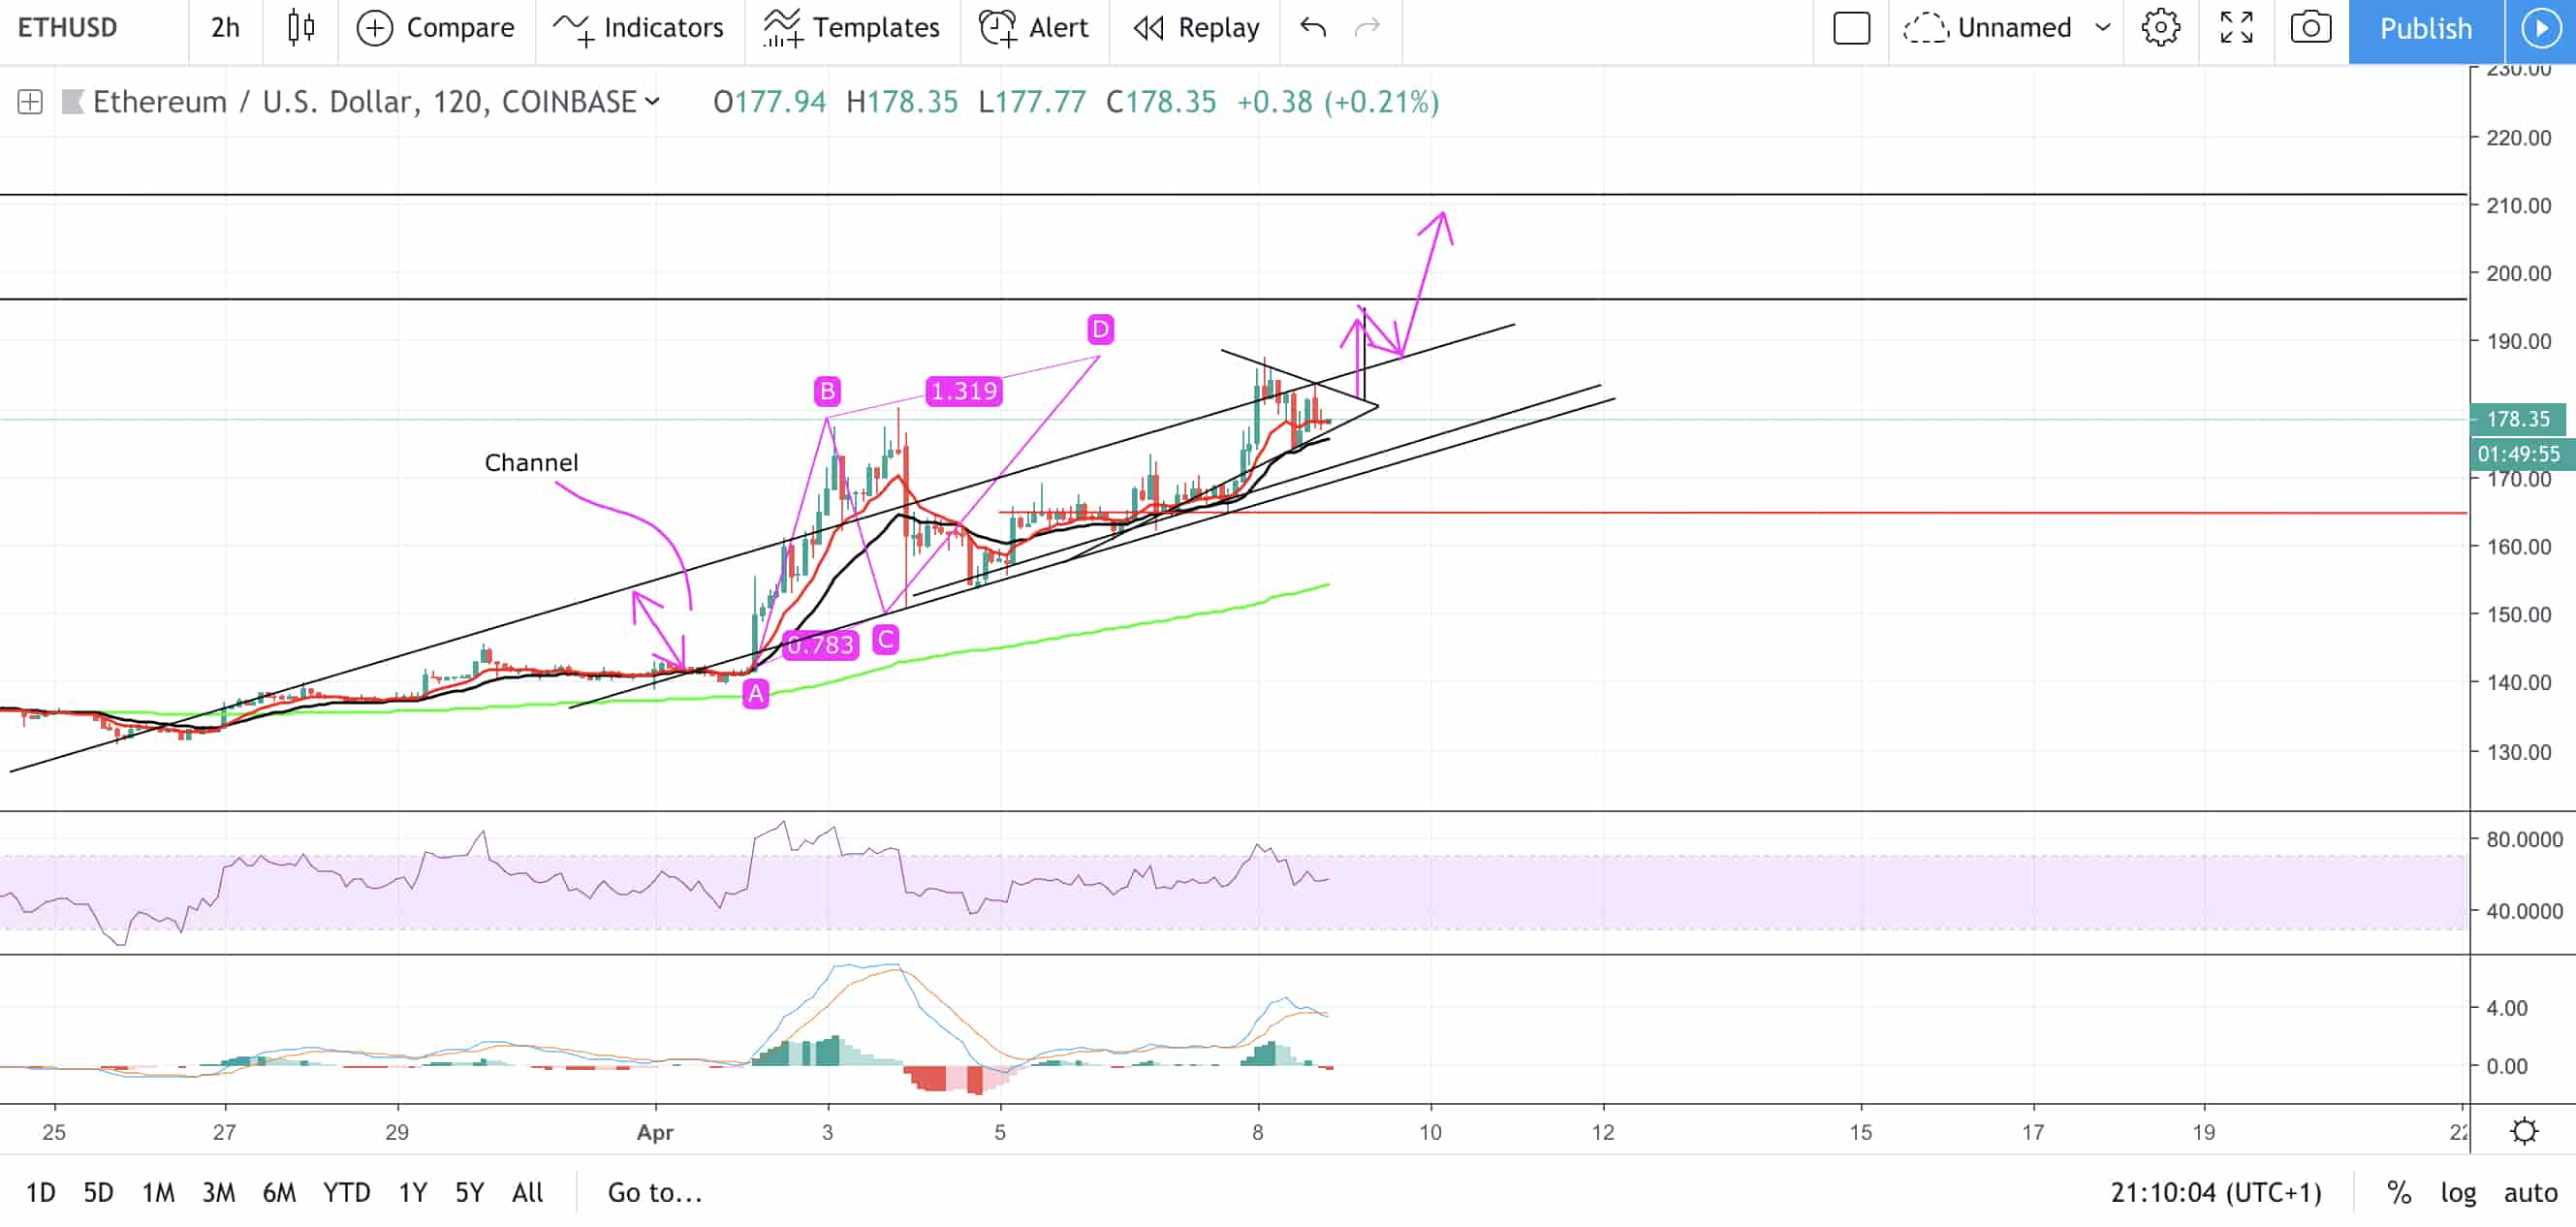
On the 2-hour chart, we can see that there was an ABCD pattern in place and, after that, a correction came and it formed a Bullish Pennant that is still standing. I believe ETH will break bullish and will close above the 200 EMA on the daily chart. In this scenario, I see it going to the $195 area, retracing to the $188 area, and then going to the $210 area.
If everything I have mentioned above gets confirmed bearish, we will see ETH falling to the $165 area which should hold.
While I am convinced, we are in a bull market, I’d be careful with these big moves that are currently happening.
Please, keep in mind that this is not financial advice, it is just me sharing my opinion. I am not a financial advisor. Always make sure to do your own due diligence before investing.


