


")


 Tokens Playing This P2E Game")
")
A bear market is when we see a long-term downward trend. Assets pull back by at least 20% during this period. We saw Bitcoin’s ATH of $69K in November 2021. Ever since Bitcoin has lost 56%. Currently, we seem to be happy with a $30K BTC price tag.
However, plenty of altcoins are down 90%. Nonetheless, we saw a recent massive jump from Bitcoin to that $30K mark. So, did we reach the bottom of the bear market? The picture below shows the recent 14-day BTC chart.
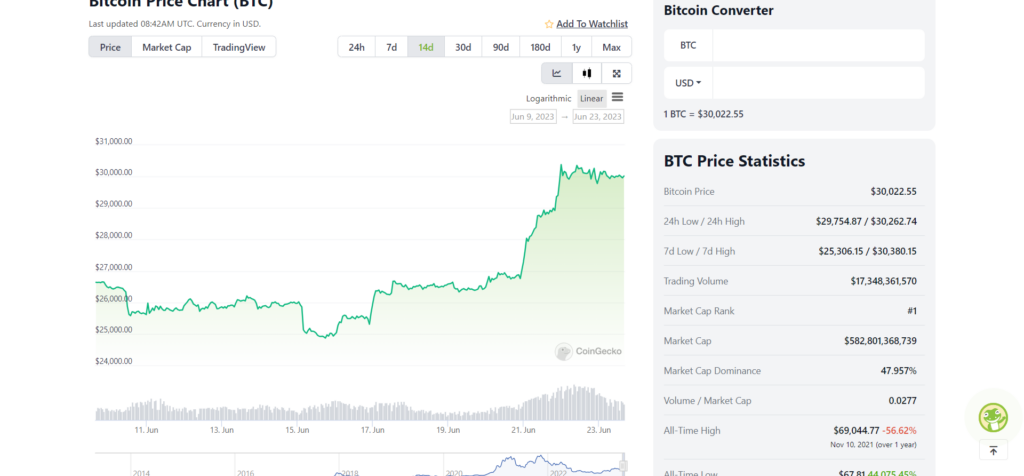
Source: CoinGecko
What Is a Bear Market?
Bear markets can be a tough period to sit through. You can see your profits evaporate. As a result, there’s a lot of panic selling. Many investors leave the space. However, for others, it offers a great opportunity to buy assets at fire sale prices. During bear markets, you can lay the foundation for a successful bull run.
Assets that you can buy at a low price now, can do a x5, x20, x50, or even a x100 during the next bull run. And then there’s always the odd one out, that does a x1000. So, besides the prolonged period of price retraction, there are a few other bear market signs. For example:
- A general loss of investor confidence.
- Few new investors.
- Lots of FUD (fear, uncertainty, doubt) and other negative news that pushes prices even more down.
Macro-economic events that we have hardly or no control over, can also start a bear market. Or, for instance, prolong it. For example, COVID-19 in 2020 or the Russian invasion and consequent war in Ukraine.
Some Indicators for a Bear Market
You can track the performance of coins in many ways. By using some TA (technical analysis) tools, you can see what the market conditions are like. For example, do these TA tools show we’re still in a bear market, or are we already bullish?
So, we’re not going to overwhelm you with too many options. However, here are two that are easy to follow and give good and strong signals.
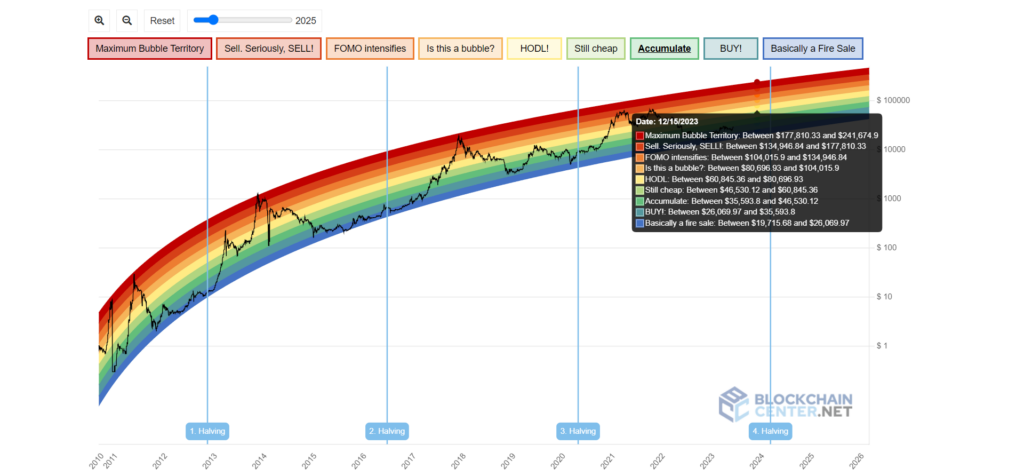
a) Bitcoin Rainbow Chart
The first indicator is the Bitcoin Rainbow Chart. This is a chart with color coding. Each color gives you an idea of what to do. For example, dark red means, sell as fast as you can and take profits. On the other hand, the blue color tells you that you’re in fire sale territory. Buy as much as you can here.
The chart also allows zooming in and out. Furthermore, you can also change a slider. This will allow you to see the predicted options for Bitcoin in the future. For example, on 1 January 2024, dark red means BTC is between $180k and $245K. However, if Bitcoin is still in the blue zone, we’re looking at a BTC price between $20k and $26K. Here’s a picture of the current Bitcoin Rainbow Chart.
b) Weekly RSI
Another useful indicator is the weekly RSI. This is the ‘Relative Strength Index’. It is a common indicator, and most exchanges have one in their spot markets. The RSI shows if an asset is either overvalued or undervalued.
- 70 or more means overvalued. BTC is overbought. Be prepared for a pullback.
- 30 or lower means undervalued. BTC is oversold, and a recovery is possible.
- Between 30 and 70, means neutral.
For example, the picture below is the RSI on Binance. The yellow box shows the RSI. The yellow arrow to the right shows the indicators. There’s another yellow arrow, pointing down. This shows the current level at 70. This indicates that a pullback is likely.

Source: Binance
Where Are We in the Bear Market?
November 2022 saw the FTX disaster unfold. Many investors lost their assets. A general feeling of capitulation happened and started. At that moment, another metric showed some interesting results. This was the Adjusted MVRV Ratio. This metric, or TA tool, measures unrealized losses in the active market. By that time, it was at an all-time low.
Crypto bear markets in December 2018 and January 2015 had similar bottoms. Furthermore, there is also the Relative Unrealized Loss metric. It tells you the combined loss versus the total market capitalization. At that moment, it was at 56%. This is a similar peak as we saw in previous bear markets. So, in general, the FTX crash seems to have marked the bottom of this bear market. You can see these two charts in our weekly market update and on-chain analysis.
You can also see this in the psychology of a market cycle chart. We passed the capitulation point. Currently, we could be around the ‘disbelief’ area. See the two yellow boxes in the picture below.
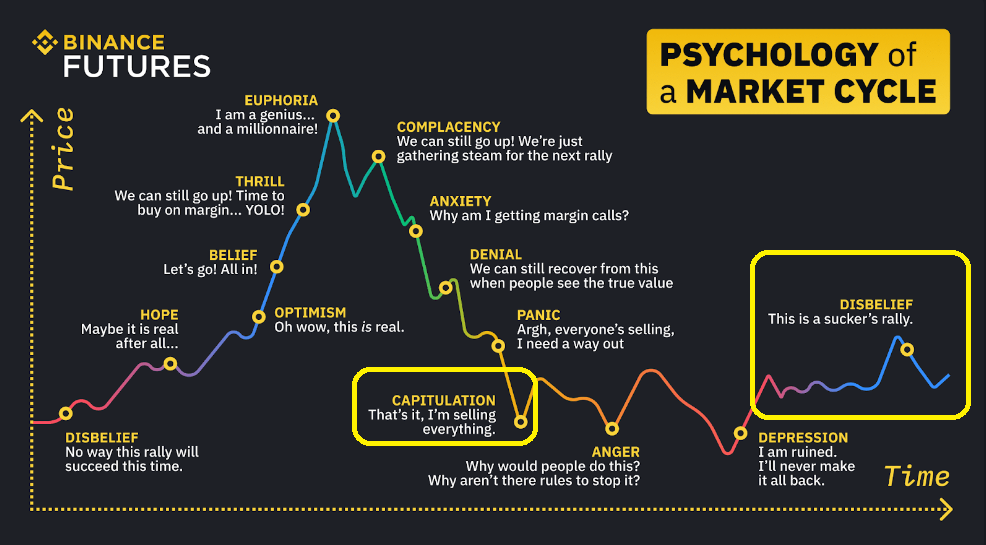
Source: Binance
Conclusion
We looked at if we reached the bottom of this bear market. However, to get to this answer, we showed you some indicators. We also explained what a bear market is. This puts everything more in perspective. So, the answer is most likely yes. The FTX crash most likely was the bottom of this bear market. We may be close to the disbelief stage of the psychology of market cycles. That’s the last step before a bull run starts.
⬆️ For more cryptocurrency news, check out the Altcoin Buzz YouTube channel.
⬆️ Our popular Altcoin Buzz Access group generates tons of alpha for our subscribers. And for a limited time, it’s Free. Click the link and join the conversation today.


