


")


 Tokens Playing This P2E Game")
")
The crypto market is going through an exceptionally calm phase as various volatility indicators are approaching their lowest recorded levels.
Amidst this tranquil environment, it is unlikely that this week’s CPI data will substantially impact the optimistic outlook for Bitcoin. However, in the event of an unexpected negative surprise, such as the CPI surpassing expectations by a significant margin, there might be concerns that higher interest rates could lead to a decline in Bitcoin’s value.
Macro Scene
We anticipate this week to be eventful, with significant data releases and notable developments in cryptocurrency. Market watchers will closely monitor the July CPI Inflation data and Jobless Claims figures on Thursday. Friday will bring insights from the July PPI Inflation and Consumer Sentiment data.
Moreover, this week will feature three Federal Reserve members speaking and approximately 15% of S&P 500 companies reporting their earnings.
De-Risking from MakerDAO
On the bearish side, concerns persist about stablecoins, particularly DAI. On-chain analysis indicates that a16z, a long-time MakerDAO investor, sold their last MKR holdings last week, leading to speculation that significant events may be on the horizon.
There are also signs of de-risking from MakerDAO by Circle or related entities, as the amount of USDC backing the DAI in circulation has significantly decreased in recent weeks. It might explain the selling pressure on USDC. These concerns could affect DAI and USDC, leaving GUSD and USDT in focus. GUSD had a hard time holding its peg due to 83% of it being used to back DAI, while USDT faces speculative possibilities surrounding regulatory issues.
Possible DOJ Charges against Binance
One concerning story from this week is the report that the Department of Justice (DOJ) is contemplating filing criminal fraud charges against Binance. Moreover, there is concern that doing so could trigger a run on the exchange. Despite already facing lawsuits from the SEC and CFTC, criminal charges would be a significant escalation.
Base And Meme Coin Mania
On the bullish side, Coinbase’s Ethereum layer 2, Base, is set to launch publicly. The ability to bridge crypto both ways may create increased demand for ETH and ERC-20 tokens.
Additionally, there might be a resurgence of meme coin mania on Base, as observed on the platform so far. It’s worth noting that some of these meme coins are rug pulls, and how Coinbase handles such issues will be intriguing. Barring any regulatory warnings or interventions, Base could potentially achieve the same level of success as BNB did in its early days. As always, DYOR!
Positive Catalyst from Hong Kong Crypto Exchanges
Another positive catalyst comes from the recent approval granted to two crypto exchanges, Hashkey and OSL, to serve retail investors in Hong Kong. Initially, they will reportedly offer BTC and ETH. Hashkey may also include USDT and USDC, which is surprising given the regulator’s stance on stablecoins being off-limits to retail investors. The restriction is likely to prevent capital flight from the mainland, a concern shared by China’s new central bank governor.
Despite these promising developments, the current low Google Search Trends for Bitcoin and Ethereum in Hong Kong suggest that retail investors are not actively buying BTC and ETH yet. However, the situation could change swiftly if another bullish catalyst emerges.
For now, bearish catalysts dominate the market, with many of these concerns centered around DeFi platforms.
Curve Saga
Last week, Curve Finance, a prominent DeFi protocol, experienced a significant setback with panic selling and withdrawals hitting hard. In just 48 hours, the TVL in Curve dropped by 50%, going from $3.2 billion to $1.6 billion, and its native CRV token saw a sharp decline of over 30%, falling from $0.73 to $0.50.
The catalyst for this crisis was a hack that exploited a dormant zero-day vulnerability present in older versions of Vyper, a third-party EVM contract-oriented, Pythonic programming language utilized by Curve and other DeFi protocols.
How Did It Happen?
The attack unfolded in two stages. On July 30th, hackers exploited pools on Curve, including Alchemix (alETH), Pendle (pETH), CurveDAO (CRV), and Metronome (mSETH), stealing around $70 million worth of assets. Following this, the CRV/ETH pool faced a second attack, capitalizing on the broken balances left behind by the initial exploit. It allowed the hackers to exchange CRV for most of the remaining ETH in the pool.
Impact on the DeFi Ecosystem
The ramifications of the Curve Finance exploit extended beyond the protocol itself, impacting the broader DeFi ecosystem. It was partially due to the $100 million loan taken by Curve’s founder, which was secured using the platform’s native Curve DAO token. Fortunately, a white hat hacker, c0ffeebabe.eth, intervened and returned approximately $5.4 million to Curve by front-running one of the attacker’s transactions.
Controversy and Aftermath
The losses from the exploit amounted to nearly half of the approximately $70 million in stolen assets, primarily originating from the CRV/ETH pool.
Please note that this reentrancy issue is associated with the use of 'use_eth', which could potentially place the WETH-related pools in jeopardy! @CurveFinance , please DM us if you need any help. https://t.co/vjc1RRce7w pic.twitter.com/Wz8DXJZK7Y
— BlockSec (@BlockSecTeam) July 30, 2023
Besides, security firm BlockSec identified and tweeted about the vulnerability in the CRV/ETH pool approximately two hours before the attackers took advantage of it. As a result, some individuals, including Curve founder Michael Egorov, have accused BlockSec of assisting the attackers by publicly disclosing a live exploit. In response, BlockSec defended its actions, stating that its intention was solely to alert users about the new issue so they could safeguard their funds.
Despite BlockSec’s purported good intentions, whether this was the most appropriate course of action remains debatable.
The Real Threat – Egorov’s Loan
However, we cannot attribute Curve’s rapid loss of confidence solely to the exploits. In perspective, the $70 million exploit affected less than 4% of Curve’s TVL at the time of the incident.
1/ Yesterday, several @CurveFinance pools were exploited.
Curve founder, Michael Egorov, currently has a ~$100M loan backed by 427.5m $CRV (about 47% of the entire CRV circulating supply).
With $CRV down 10% over the past 24 hours, the health of Curve is in jeopardy. 🧵⬇️ pic.twitter.com/EKpQCkDs6W
— Delphi Digital (@Delphi_Digital) August 1, 2023
The actual threat arose when users realized the potential cascading effect on the price of CRV, putting Curve founder Michael Egorov’s “sleeping dragon” at risk – a $100 million loan secured by $427.5 million worth of CRV.
Egorov’s CRV collateral constitutes approximately 47% of the entire circulating supply of CRV. If the token’s price were to drop, Egorov’s loans across lending platforms like Aave, Fraxlend, Inverse Finance, and Abracadabra could face liquidation. This situation would introduce even more volatility into the broader DeFi ecosystem, as the bad debt would burden many of these lending platforms due to the illiquidity of CRV tokens.
The Irony of Egorov’s Bailout
To avert the risk of liquidation and further volatility, Egorov swiftly took action. He executed a series of Over-The-Counter trades to repay a portion of his loans. Additionally, he created a new liquidity pool on Curve for FraxLend’s CRV/FRAX market, incentivizing users to lend FRAX and reducing the CRV/FRAX utilization rate by rewarding CRV to those participating.
The Curve OTC War updates:
17.5M CRV to 0xf51
5M CRV to Justin Sun
4.25M CRV to DCFGod
2.5M CRV to Ox4d3
2.5M CRV to DWF Labs
2.5M CRV to Cream: Multisig
1.25M CRV to 0xcb5
3.75M CRV to machibigbrother.eth
250k CRV to 0x9bf— Sandra (@sandraaleow) August 1, 2023
While Egorov’s measures have temporarily prevented liquidation and alleviated further volatility, the situation where other major whales in the DeFi space bailed him out is reminiscent of scenarios often witnessed in traditional finance. Ironic, right?
Let’s look at on-chain data.
More Sideways Movement Ahead?
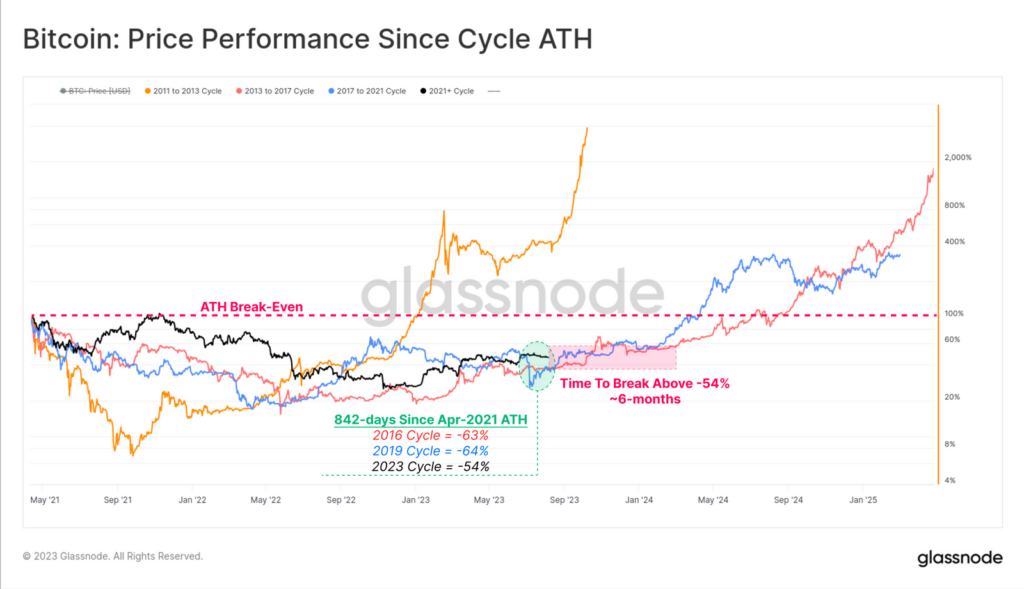
Source: GlassNode
It has been more than 840 days since the bull market’s peak in April 2021. Interestingly, the current recovery in 2023 is showing some promising signs compared to the last two cycles. The market is trading at -54% below its all-time high, an improvement from the historical -64% drawdown experienced in previous cycles.
Notably, the 2015-2016 and 2019-2020 cycles saw six months of sideways movement and boredom before the market eventually accelerated above the -54% drawdown. This observation suggests that a similar period of monotony may be on the horizon.
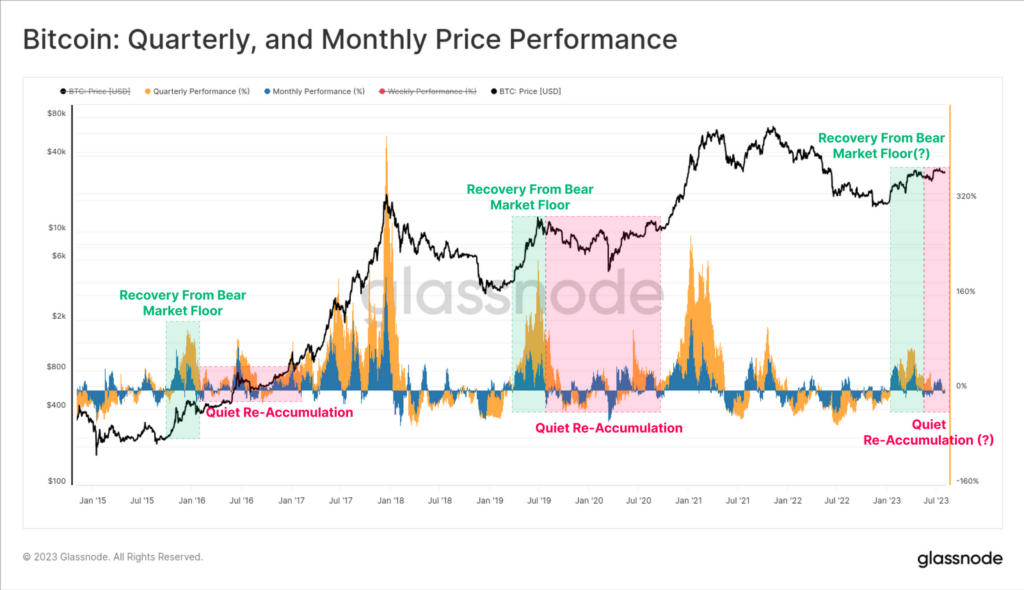
Source: GlassNode
Despite a blazing start to 2023, quarterly and monthly price performances have cooled off. This pattern is reminiscent of prior cycles where the initial rally off the bottom was robust but followed by an extended period of choppy consolidation.
Bitcoin analysts often refer to this phase as the “re-accumulation period.” During this time, the market is characterized by uncertainty and erratic movements as investors re-evaluate their positions and wait for new catalysts to emerge.
Long-Term Holders Still HODLing?
At the end of June 2023, the Bitcoin network experienced a notable spike in mature spending, a trend commonly observed during bull markets. Long-term coin holders who have held their coins for more than 155 days seize opportunities amid a strengthening market to take advantage of favorable conditions.
However, the Binary Coin Days Destroyed (Binary CDD) is showing muted activity due to low spending. Such low spending is typically associated with bearish phases of Bitcoin and a weakening market.
For those unfamiliar with the term, Binary CDD is a binary value. If the Supply-Adjusted Coin Days Destroyed (Supply-Adjusted CDD) is higher than the average Supply-Adjusted CDD, the Binary Coin Days points to ‘1’. Otherwise, it points to ‘0’. This indicator shows whether long-term holders move their coins more or less than average.
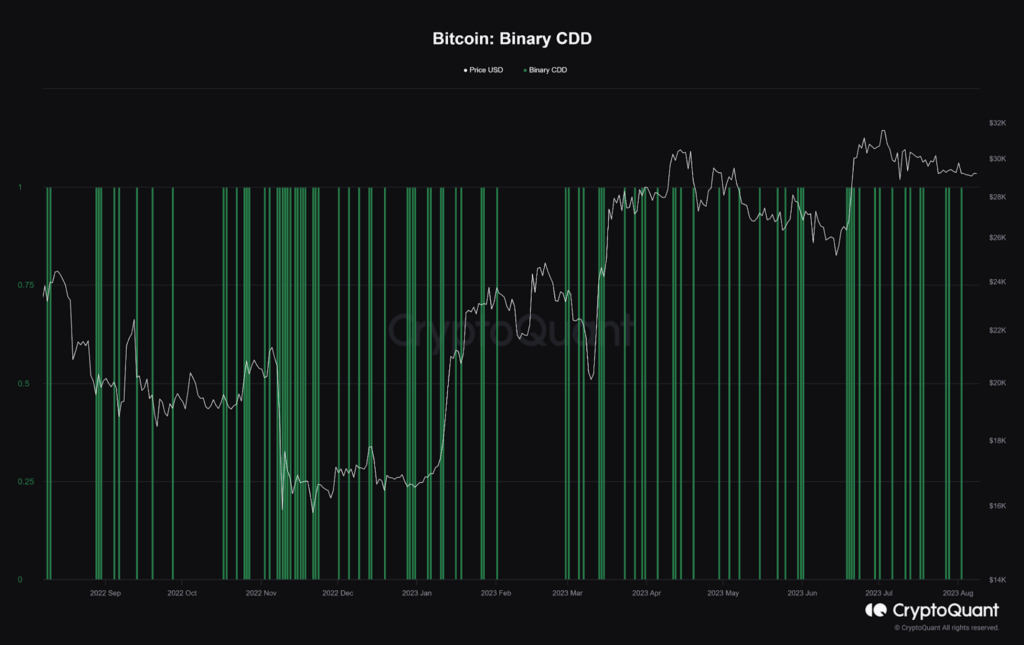
Source: CryptoQuant
A high density of ‘1’ values indicates that long-term holders are moving their coins, potentially signaling their intent to sell. On the other hand, ‘0’ values indicate a period when mature coins are less inclined to move, typically observed during a scaling bull market in Bitcoin. Long-term holders often take advantage of lower Bitcoin prices to accumulate more coins during such times.
The theory behind this indicator suggests that long-term coin holders may be apprehensive about the current state of the crypto industry in the absence of a scaling bull market. As a result, they may choose to wait out the uncertainty and keep most of their coins in cold wallets for the time being.
Power of BTC Price Growth On The Decline
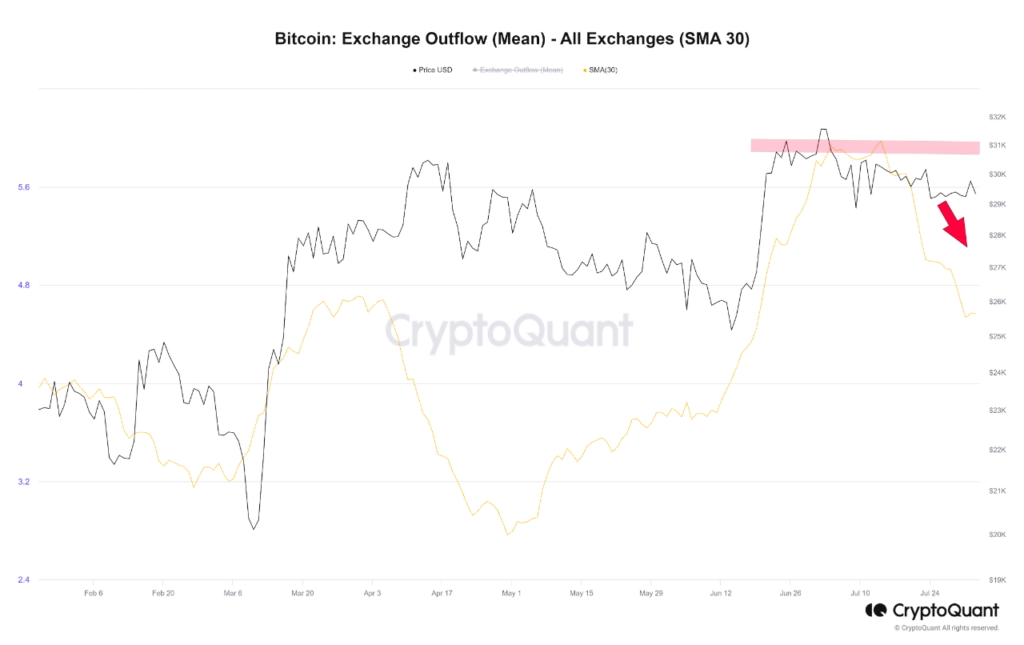
Source: CryptoQuant
In supply and demand dynamics and market making, exchanges are crucial as significant entities in the cryptocurrency market. Alongside on-chain data, examining the behavior of actors on exchanges is one of the best methods to assess market conditions.
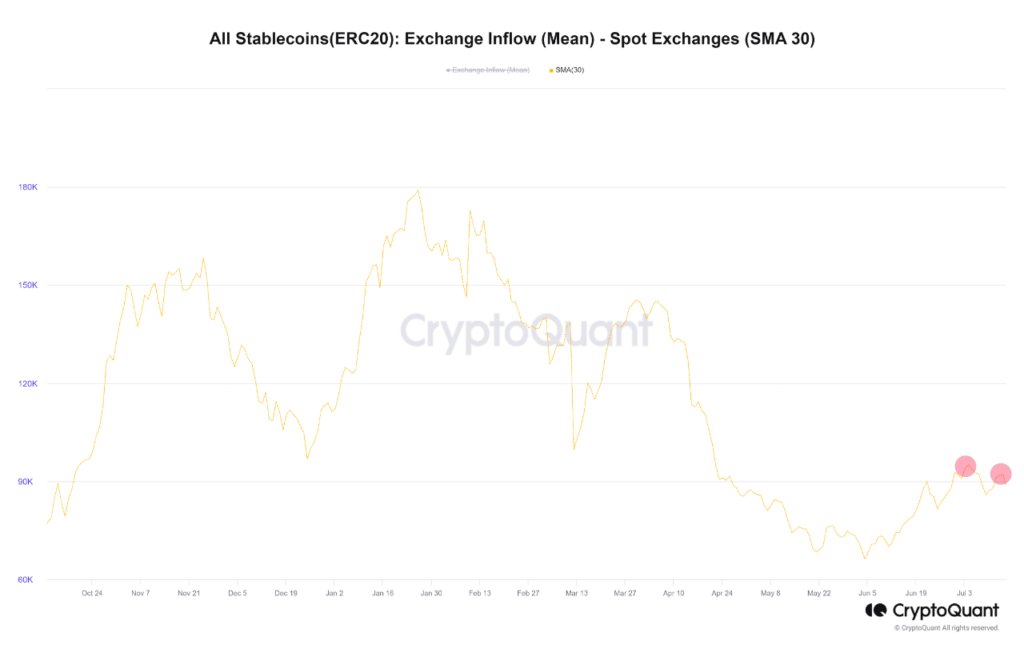
Source: CryptoQuant
Three essential factors for Bitcoin’s price growth and bullish speculation by exchange participants are worth considering:
- The Outflow Mean from the spot market
- The Inflow Mean of stablecoins to exchanges
- The Trading Volume of Bitcoin on exchanges
All of these reflect the necessary liquidity in the market.
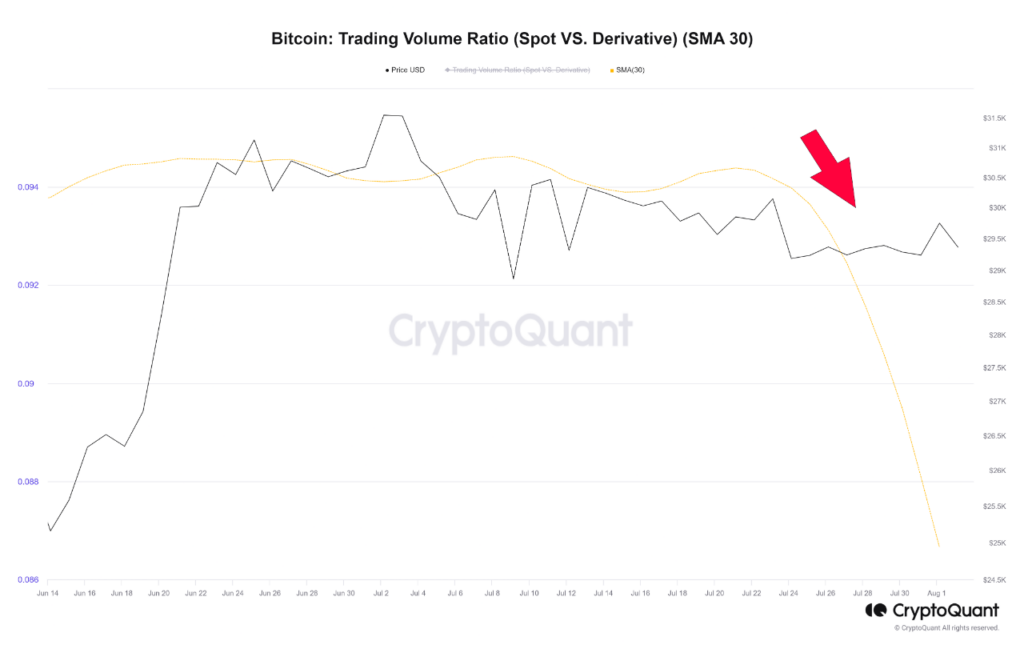
Source: CryptoQuant
In July, all three of these factors experienced a simultaneous decrease, indicating a decline in liquidity, which is essential for facilitating another price jump. The reduction of necessary liquidity based on these criteria can lead to temporary or mid-term adjustments in the market. Therefore, monitoring the overall liquidity trend in the coming days is paramount for market participants.
Bitcoin’s Low Volatility and Its Implications
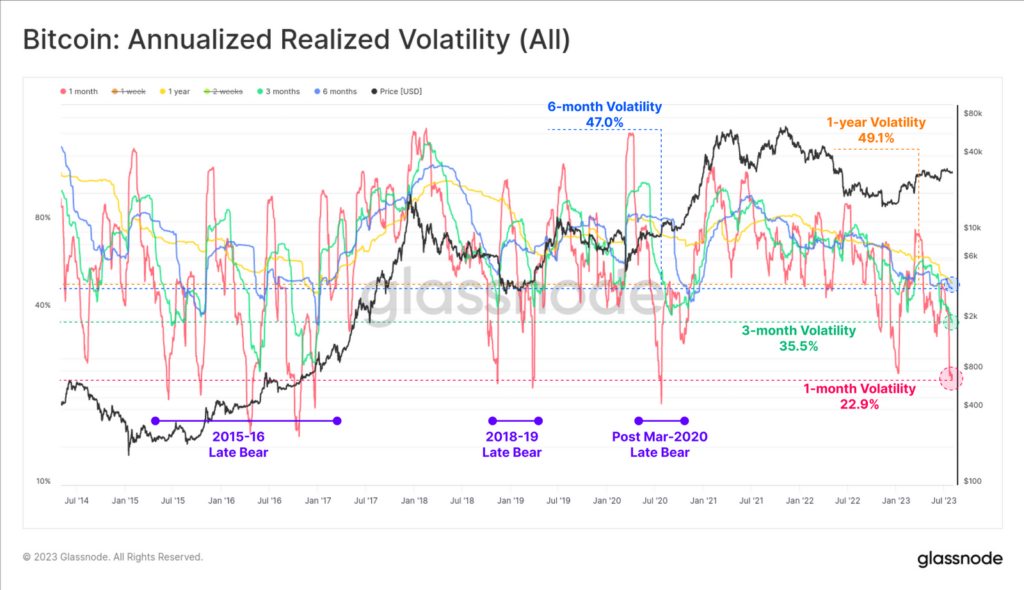
Source: GlassNode
In 2023, Bitcoin’s realized volatility across various observation windows, ranging from 1-month to 1-year, has significantly decreased, reaching multi-year lows. Particularly, the 1-year volatility window is now at levels not seen since December 2016. It marks the fourth instance of extreme volatility compression in Bitcoin’s history, which has historically been infamously volatile.
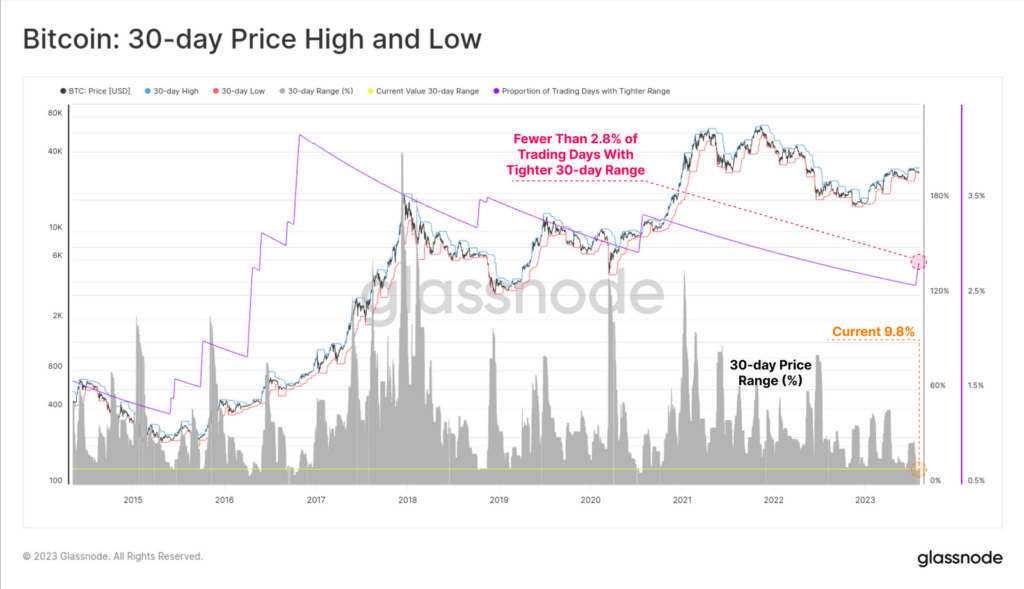
Source: GlassNode
The current price range between the 7-day high and low is merely 3.6%, and only 4.8% of all trading days have experienced a tighter weekly trade range. Similarly, the 30-day price range has been extremely constricted, with just a 9.8% band over the last month, and only 2.8% of all months have been tighter. These tight ranges indicate a prolonged period of consolidation, a rare occurrence in the notoriously volatile Bitcoin market.
Source: GlassNode
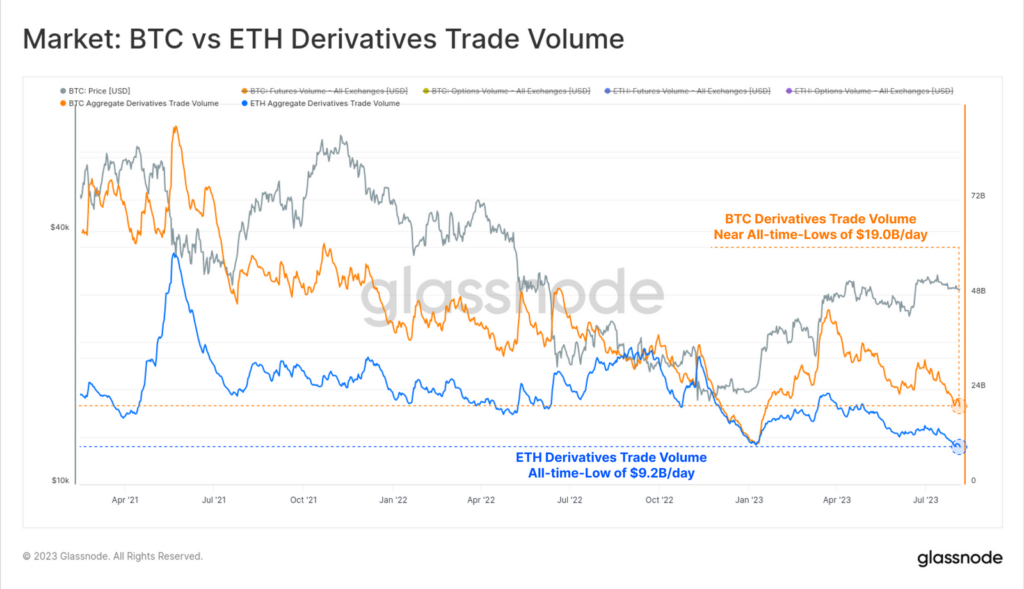
This quiet spell extends to derivatives markets for both Bitcoin and Ethereum. Futures and options trade volumes for these assets are at or approaching all-time lows.
Market’s Risk-Off Stance and Shifting Dominance in Futures Markets
Source: GlassNode
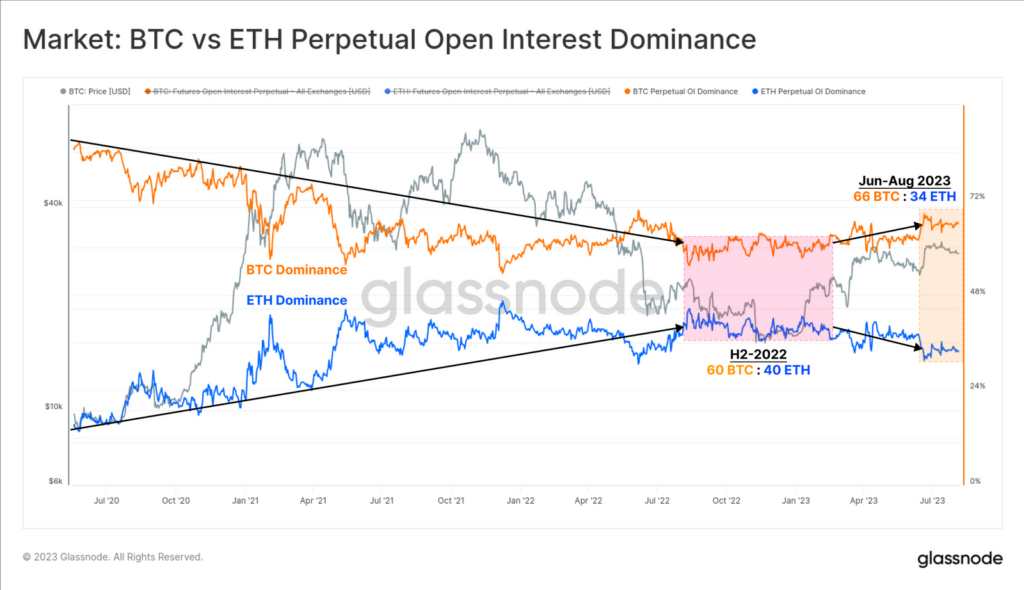
Additionally, the market is currently displaying a relatively risk-off stance, as evidenced by Bitcoin’s increasing dominance within futures markets. Between 2021 and 2022, Ethereum futures markets saw a steady rise in trade volume and open interest, surpassing Bitcoin and peaking at a 60 BTC:40 ETH split in H2-2022.
However, in the present year, the scales have tilted back in favor of Bitcoin, indicating a shift in sentiment towards the leading cryptocurrency. This trend suggests that lighter liquidity and a reduced risk appetite motivate investors to move capital towards assets perceived as lower-risk, ultimately pushing Bitcoin’s dominance higher in futures markets.
Options Market and the Volatility Crush in Bitcoin
Source: GlassNode
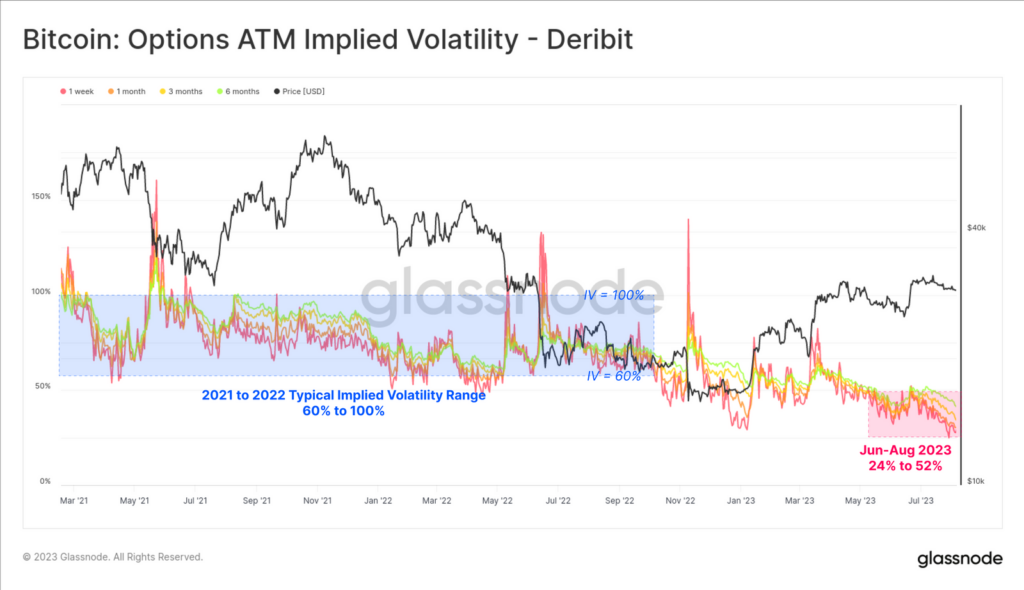
Looking at the options markets, it becomes evident how severe the volatility crush has been, as implied volatility across all contract expirations has collapsed to all-time lows.
Bitcoin markets are notorious for their high volatility, with options trading at implied volatility levels ranging from 60% to over 100% for most of 2021-22. However, options are currently pricing in the smallest volatility premium in history, with implied volatility (IV) ranging between 24% and 52%, less than half of the long-term baseline.
This significant drop in implied volatility raises an intriguing question. Considering that fewer than 5% of all trading days have experienced a similar price range contraction, it suggests that Bitcoin may no longer be as infamously volatile as it once was—or it could imply that volatility is currently being mispriced in the market.
Traders Embrace Volatility, but Recent Drop in Trade Volume Indicates Low Volatility
Source: Kaiko
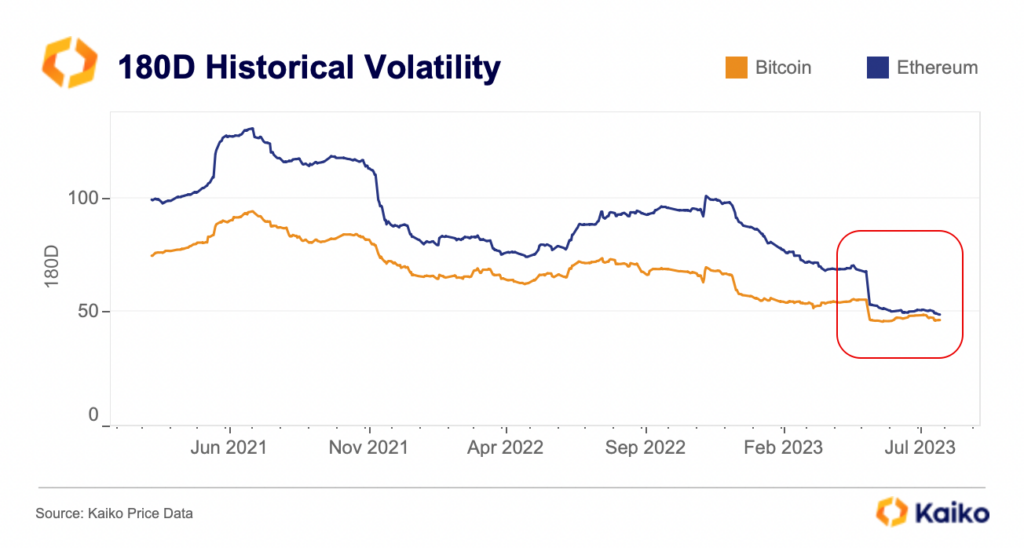
Currently, both BTC and ETH are experiencing 180-day volatility at multi-year lows, with percentages of 46% and 49%, respectively.
BTC began the year trading at $17k and had seen its gains slow down considerably compared to previous bull markets when it experienced rapid surges over short periods. Similarly, ETH, which has historically been much more volatile than BTC, is now exhibiting similar sluggishness in its price movement.
The market’s present state is remarkably subdued, prompting questions about whether heightened volatility lies ahead. With both BTC and ETH experiencing multi-year low volatility, traders are closely monitoring the situation to determine the potential direction and magnitude of future price movements.
Trade Volume Continues To Fall
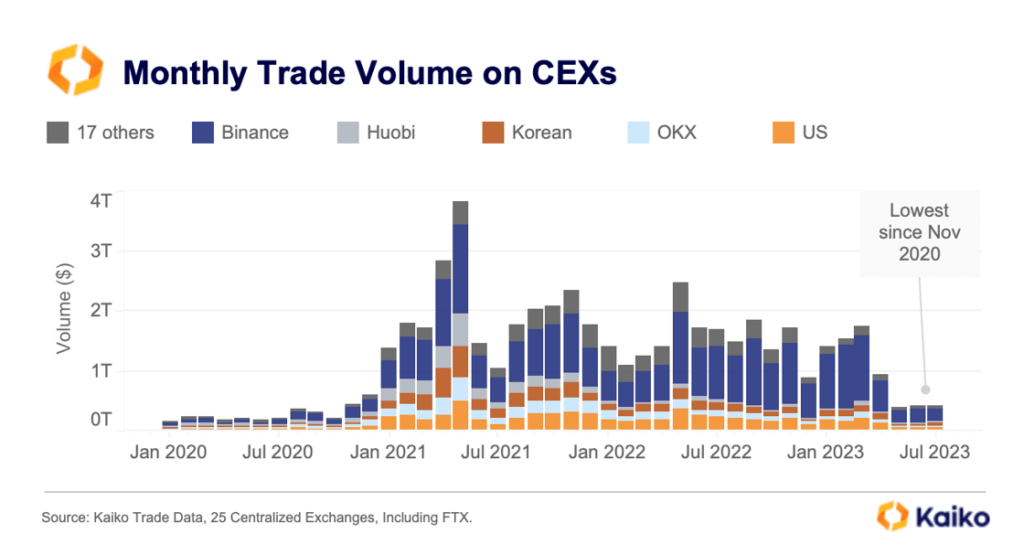
Source: Kaiko
Despite Bitcoin experiencing a remarkable surge of 75% in 2023, the trade volume in the cryptocurrency market has continued to decline. Almost all exchanges witnessed double-digit decreases in trade volume in July compared to the previous year. A collapse in long-term volatility accompanies this trend, indicating that overall market participation remains low.
Among the exchanges, U.S. platforms saw the most substantial drop in volume, averaging around an 80% decrease. However, Coinbase, benefiting from a flight to quality after the SEC lawsuit against Binance.US, experienced a comparatively smaller decline in trade volume than the broader crypto market.
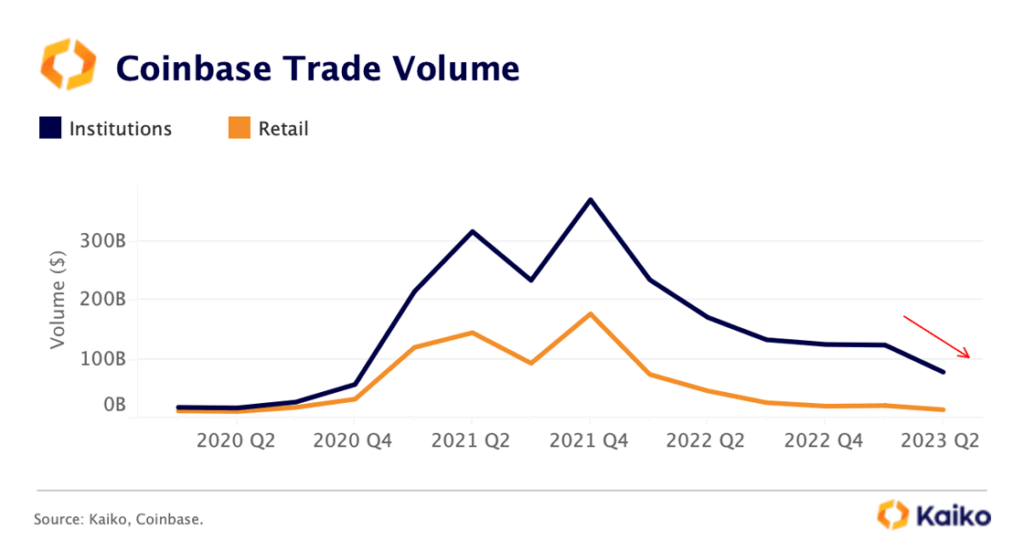
Source: Kaiko
Nevertheless, last week, Coinbase’s earnings call disclosed a strong decline in altcoin and institutional trading, suggesting that the adverse regulatory environment and bear market have impacted the exchange’s performance. A steady increase in the share of BTC trading on the platform mirrors this shift in trading behavior. In Q2, BTC trading rose to 40%, up from 32% in Q1, reaching its highest level since Q4 2020.
⬆️ For more cryptocurrency news, check out the Altcoin Buzz YouTube channel.
⬆️ Our popular Altcoin Buzz Access group generates tons of alpha for our subscribers. And for a limited time, it’s Free. Click the link and join the conversation today.


