


")


 Tokens Playing This P2E Game")

Following up my previous TA, Bitcoin broke the triangle bullish. It went above the price target, however, it did not stay above the support for long (it retraced short after the bearish 9th TD count). What might happen next? Let’s take a look.
Coinbase – BTC/USD Short-Term Chart Analysis
- Current Price on CoinGecko at the moment of writing this article: $10,150
- Resistance levels: $11,300, $10,000, $17,200-300
- Support levels: $8,300-400
- EMAs: RED 9, BLACK 20, GREEN 200
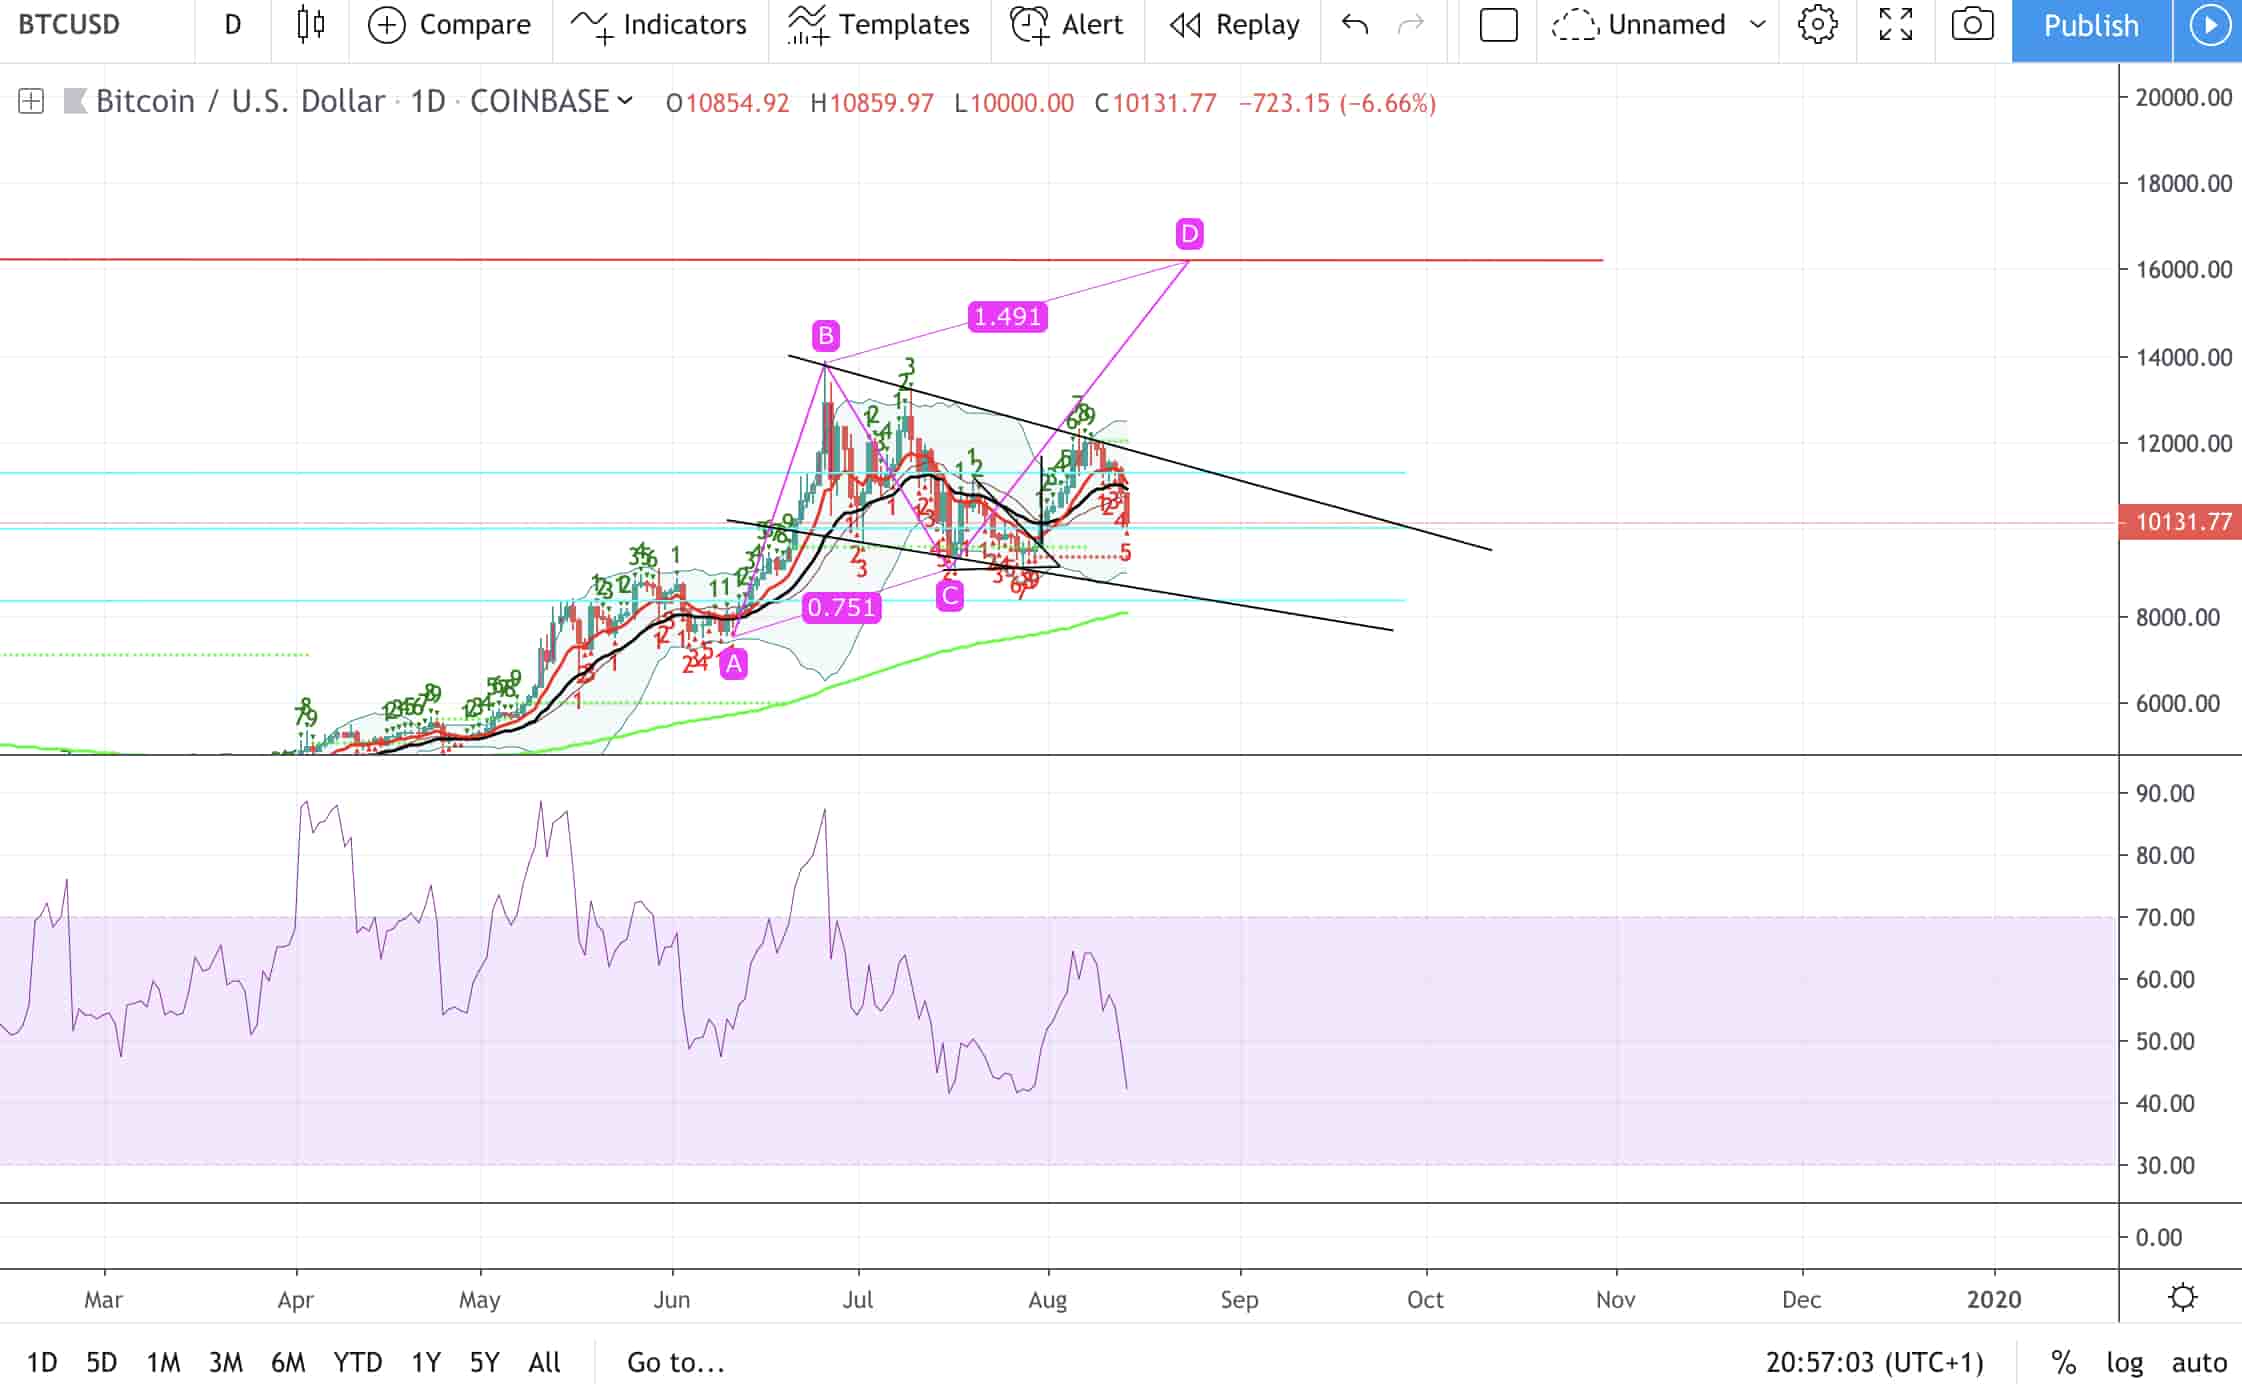
If we have a look at the daily chart, we can see that we are above the $10,000 support level which I consider an important support level. We can also see that we are moving inside a descending wedge, we are at the TD count of 5, and facing RSI support as well.
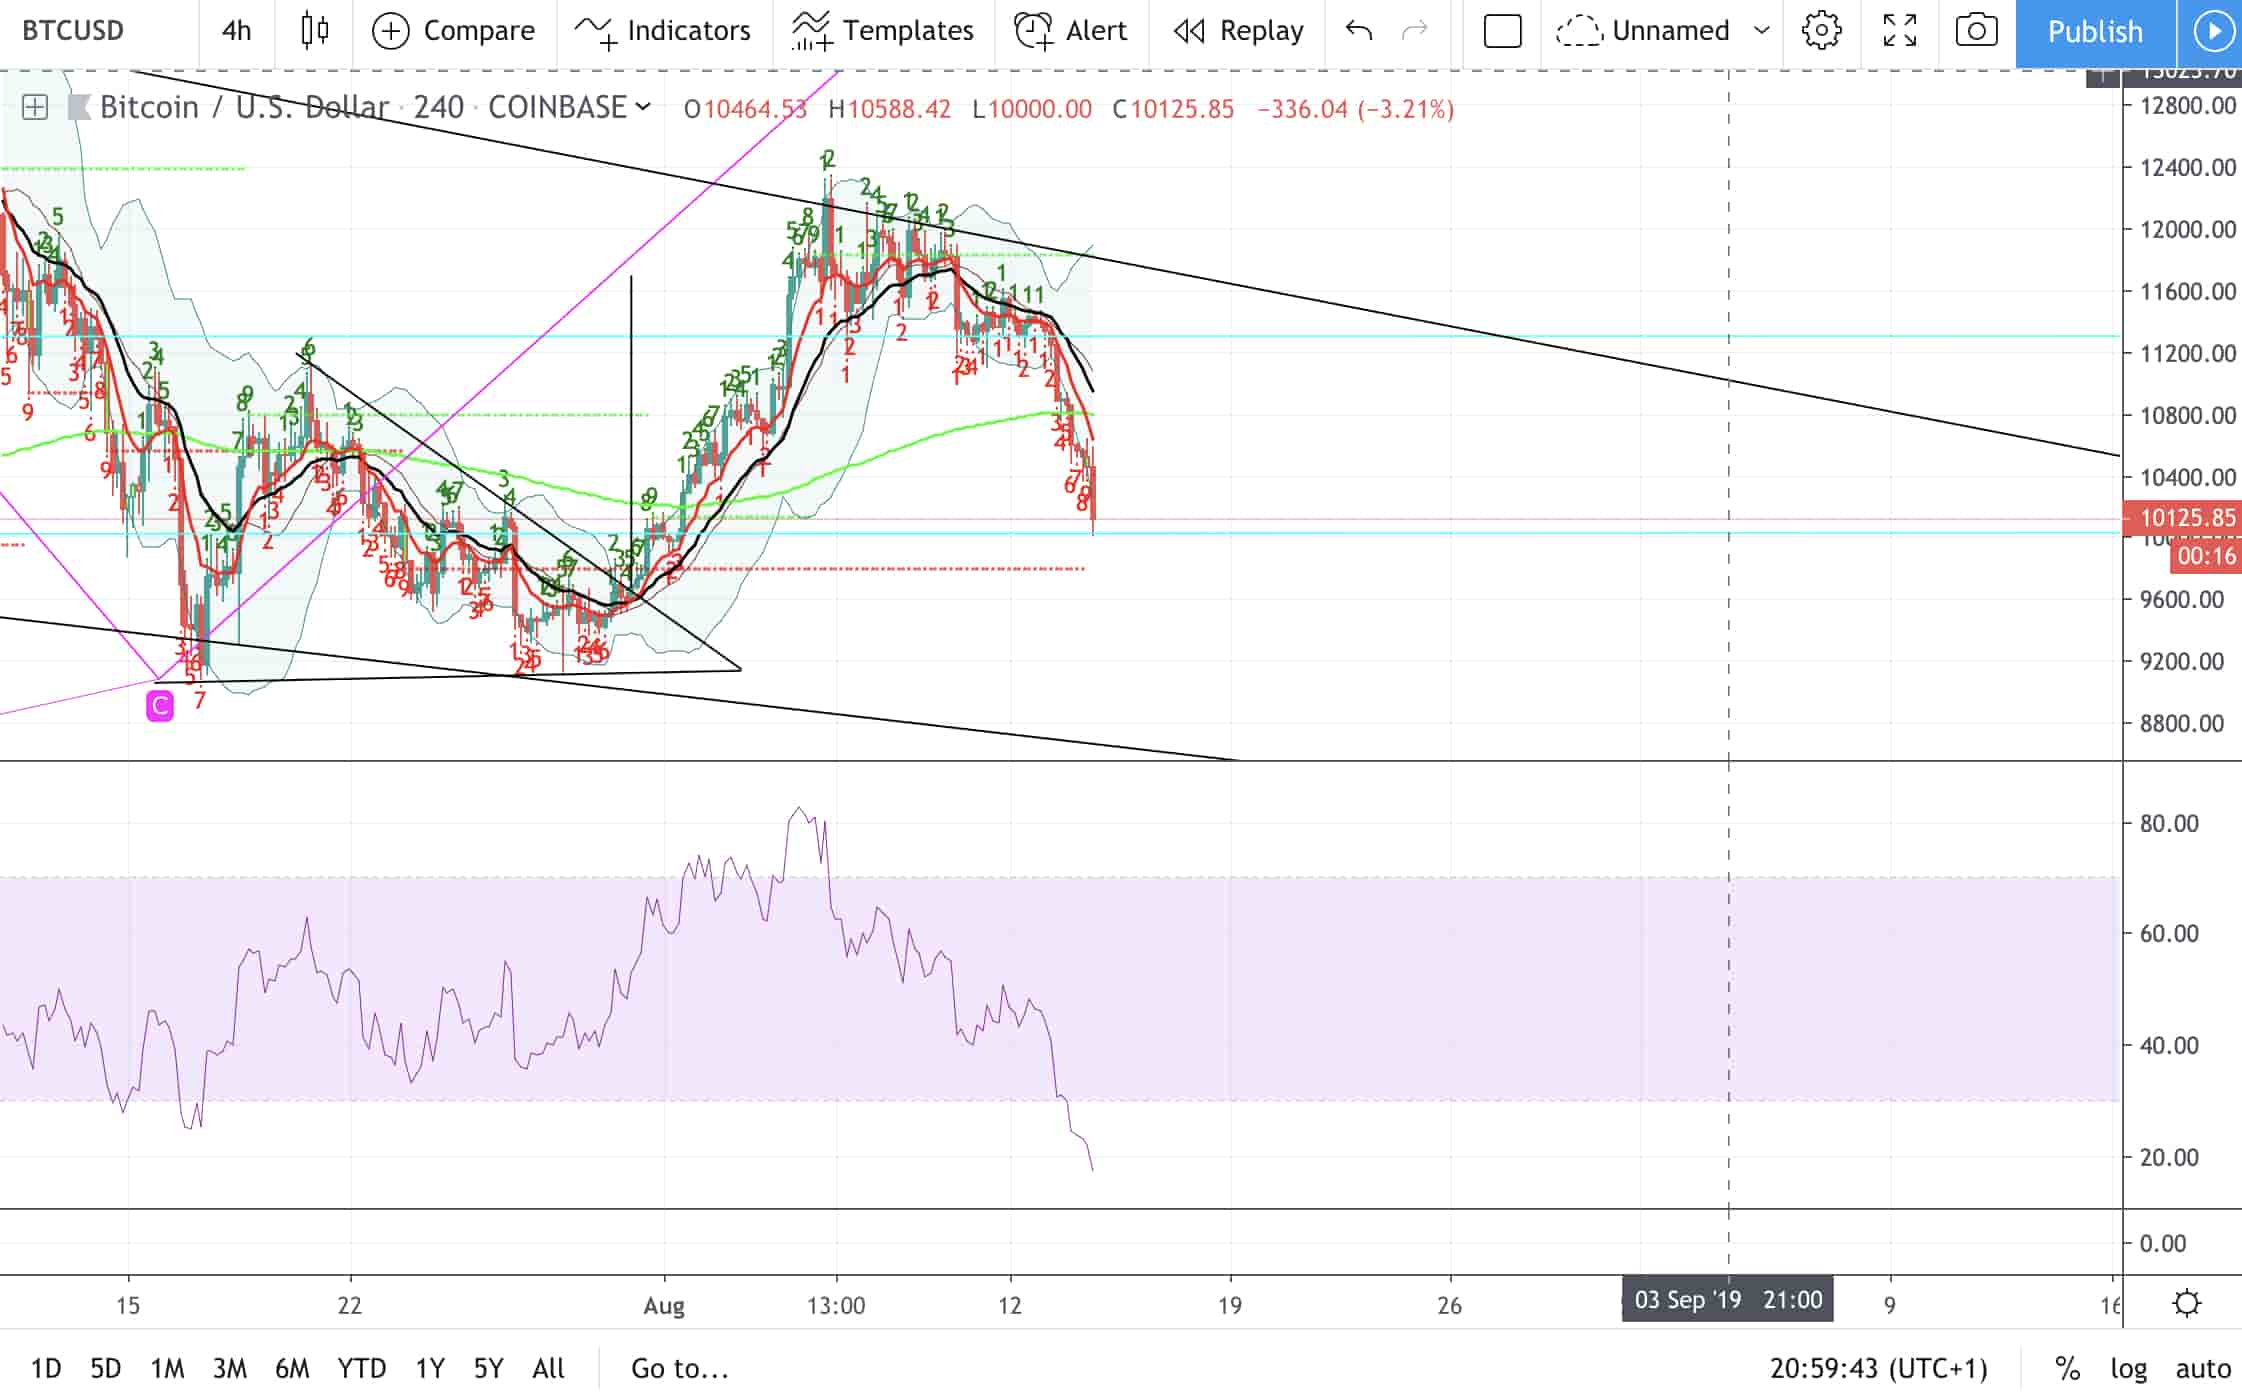
On the 4-hour chart, Bitcoin is heavily oversold on the RSI indicator and we have passed the 9th TD bullish count.
What should we expect next?
Given the indicators on the 4-hour timestamp, we should expect a push towards the $11,3k resistance level (a level I believe we will not break above too soon) in the short-term. After that, we should expect a break of the $10k support. We will continue to move inside the descending wedge for a while (somewhere near the 9th TD count). I believe that the wedge will not break bearish, even so, we may see $8,300 level or lower.
The bullish scenario would be to stay above the $10,000 support level for a while and break the wedge bullish sooner. The ABCD pattern is still valid and is pointing towards $16,000 in that case.
It’s important to know that many are looking to buy at $8,000 or lower. Even so, I am bearish regarding Bitcoin at the moment.
You need help to understand all the technical analysis and trading terms? Click here.
Please Note: This is not financial advice, it’s just me expressing my own opinion over the market. Please do your own due diligence before investing in such volatile markets.


