


")


 Tokens Playing This P2E Game")

With the wide range of institutional investors coming in, we saw a highly impressive rally in BTC price. From this year’s low price around $3,000 to an all-time high price above $42,000, we saw a gain of almost 14 times this year in BTC from its yearly low price during the crash in March.
BTC was struggling to break the resistance of $20,000, and we saw multiple rejections at that level. But once the resistance at $20,000 was broken, we saw a highly impressive rally by BTC. One by one, all the checkpoints were reached and flipped to support. We saw a small resistance towards $30,000, but even that did not last for long and BTC jumped quickly from $30,000 to $42,000 within a week to establish an all-time high price.
But was $42,000 the top, and are we going to see a major correction in BTC price? Let us find out.
BTC – Price Prediction – 4 hour
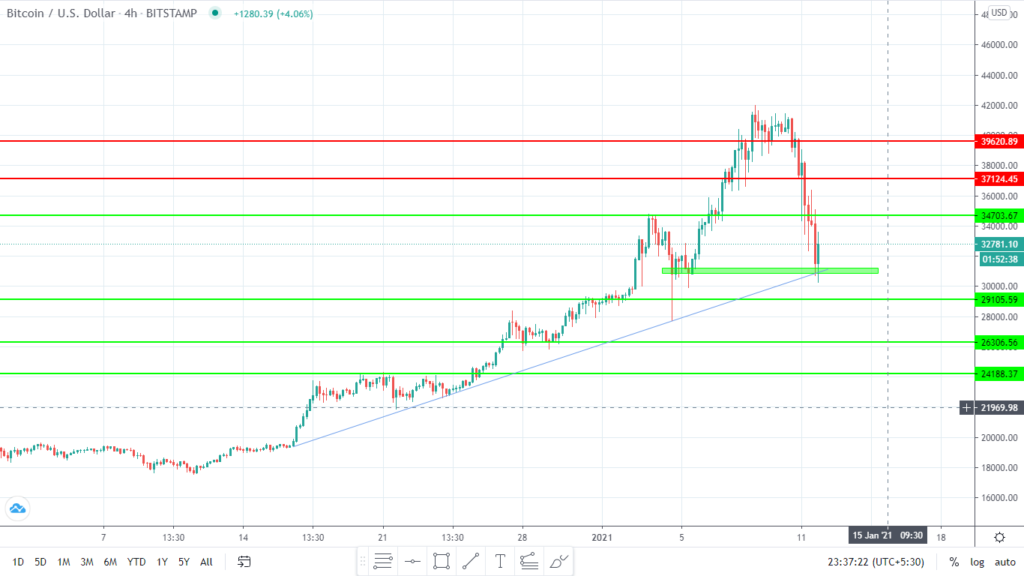
The 4 hourly chart on BTC is very bearish. BTC could not hold the support at $34,000, and we saw a sell off towards the lower support of $31,000. This area also corresponds to the trend line support area. BTC has to close multiple 4 hourly candles above this green support zone of $31,000 and quickly reclaim $34,000 and flip it to support.
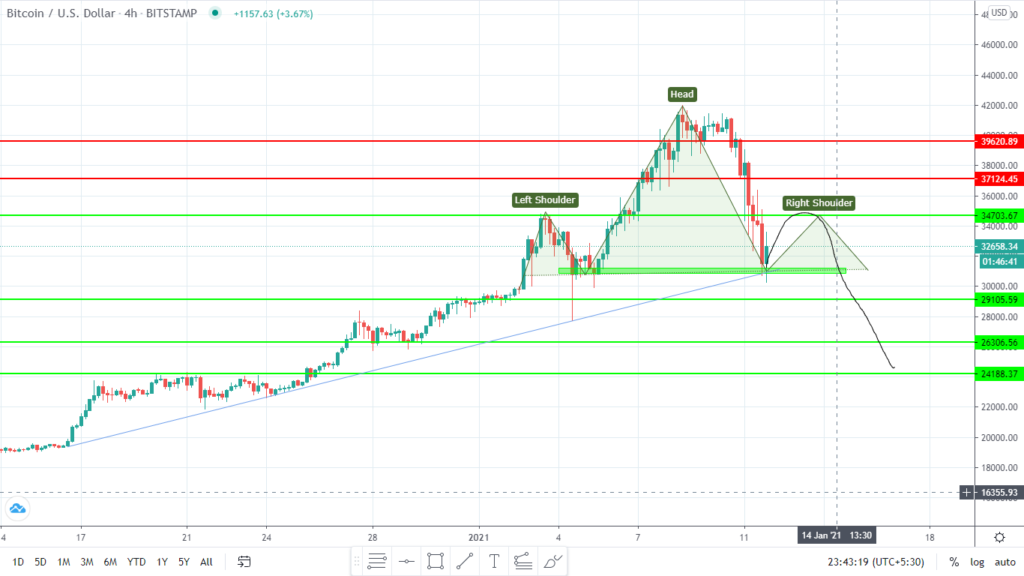
If not, this could pan out to be an inverse head and shoulder with the right shoulder forming at $34,000, and we could start seeing a move towards $29,100, $26,300, and $24,100.
BTC – Price Prediction – Daily
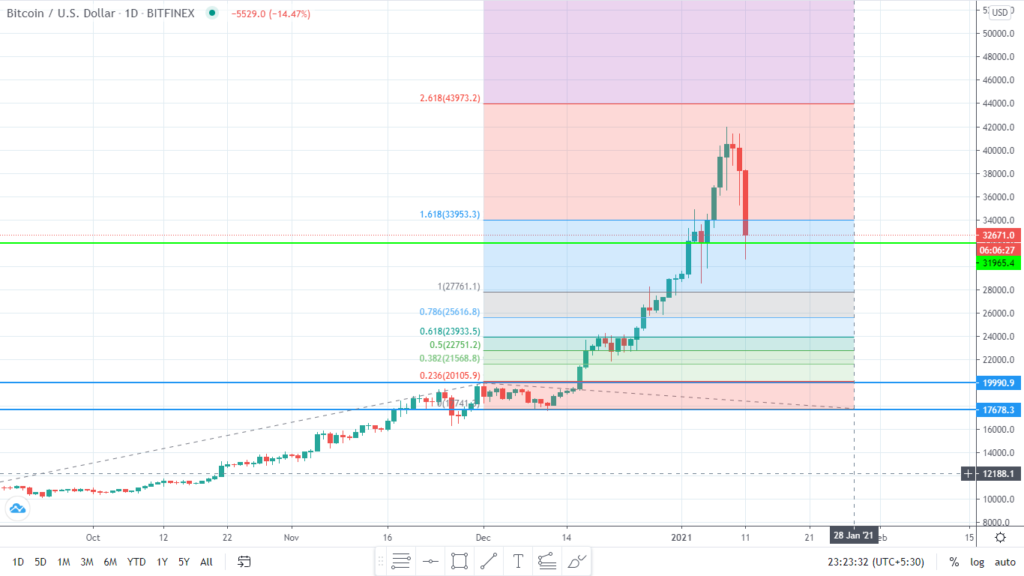
BTC almost reached the 2.618 fib at $44,000 as per our previous chart. A rejection from this price or the area around this price was expected, and BTC has now dropped to our support zone of $32,000. This is an important level to hold for the correction to be over. If this level does now hold, we can start seeing a move towards 0.618 fib at $24,000 with stops at $27,700 and $25,600. How BTC reacts at the lower fibs will determine the next move of BTC. IF $32,000 holds, we could again start seeing BTC making a move towards $44,000.
BTC/USD – Price Prediction – Weekly
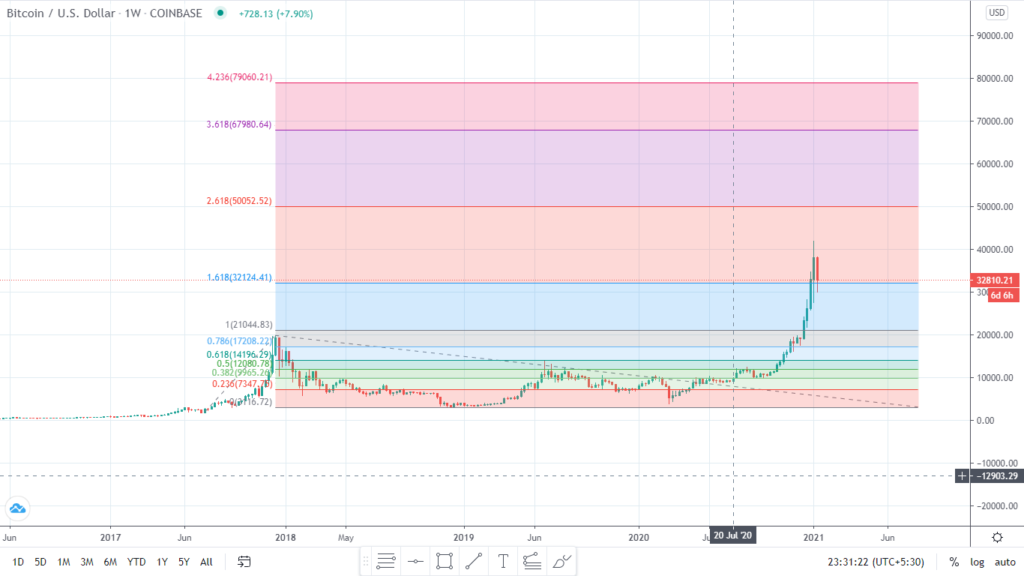
Weekly candle also suggest that the fib at $32,000 is important. If we break this fib, there won’t be any substantial support till early $20,000 region. If this region can hold and we manage to close the weekly candle above this 1.618 fib, we can start targeting the 2.618 fib towards $50,000.
Images courtesy of TradingView.
Disclaimer
The information discussed by Altcoin Buzz is not financial advice. This is for educational and informational purposes only. Any information or strategies are thoughts and opinions relevant to accepted levels of risk tolerance of the writer/reviewers and their risk tolerance may be different than yours. We are not responsible for any losses that you may incur as a result of any investments directly or indirectly related to the information provided.
Do your own due diligence and rating before making any investments and consult your financial advisor. The researched information presented we believe to be correct and accurate however there is no guarantee or warranty as to the accuracy, timeliness, completeness. Bitcoin and other cryptocurrencies are high-risk investments so please do your due diligence. Copyright Altcoin Buzz Pte Ltd. All rights reserved.


So basically you are confident the price will either go up or down.