


")


 Tokens Playing This P2E Game")

Crypto market intelligence platform, Messari, recently published its quarterly report on Solana. Its recent Solana Q3-2023 report (July to September) showed that Solana ended Q3 with an $8.4 billion market cap and 17% growth quarter-on-quarter (QoQ).
The report noted that Solana suffered a brief price decline, possibly caused by some macroeconomic factors, including the potential liquidation of Alameda/FTX’s SOL. However, SOL traded performed better than most cryptocurrencies. Its market cap rank increased from 10 to 7 QoQ. Let’s discover more about Solana’s report.
Solana’s Performance in Q3-2023
Solana also recorded an increase in its revenue in Q3, as indicated by all the fees that the protocol collected. Messari reports that SOL’s revenue increased by 10% to 185,400 SOL and by 19% to almost $4 million. Solana burned half of those fees and gave the remaining fees to the block producers as incentives. The report noted that the burned tokens did little to reduce Solana’s inflation rate, which was 5.8% at the conclusion of the quarter.
For more on Solana's Q3, including financial, network, and ecosystem metrics, check out the full report from @ph0rt0n below. ⬇️https://t.co/PgaXSww0Qa
— Messari (@MessariCrypto) October 18, 2023
Messari predicts that the inflation rate will drop by 15% each epoch until it hits 1.5%. According to the data, 71.6% of the SOL supply eligible for staking has been staked. And these holders opted out of dilution from issuance. Also, at 1.1%, or 31% higher QoQ, SOL’s annualized real yield rate at the end of Q3-2023 was somewhat positive. Now, let’s look at the network analysis:
Solana’s Network Usage in Q3-2023
Solana’s network activity, measured by fee payers and non-vote transactions, dropped QoQ and hit yearly lows (this excludes the network outage on February 25, 2023). Average daily fee payers fell 37% QoQ to 94,100, while average daily non-vote transactions fell 25% QoQ to 24.7 million.
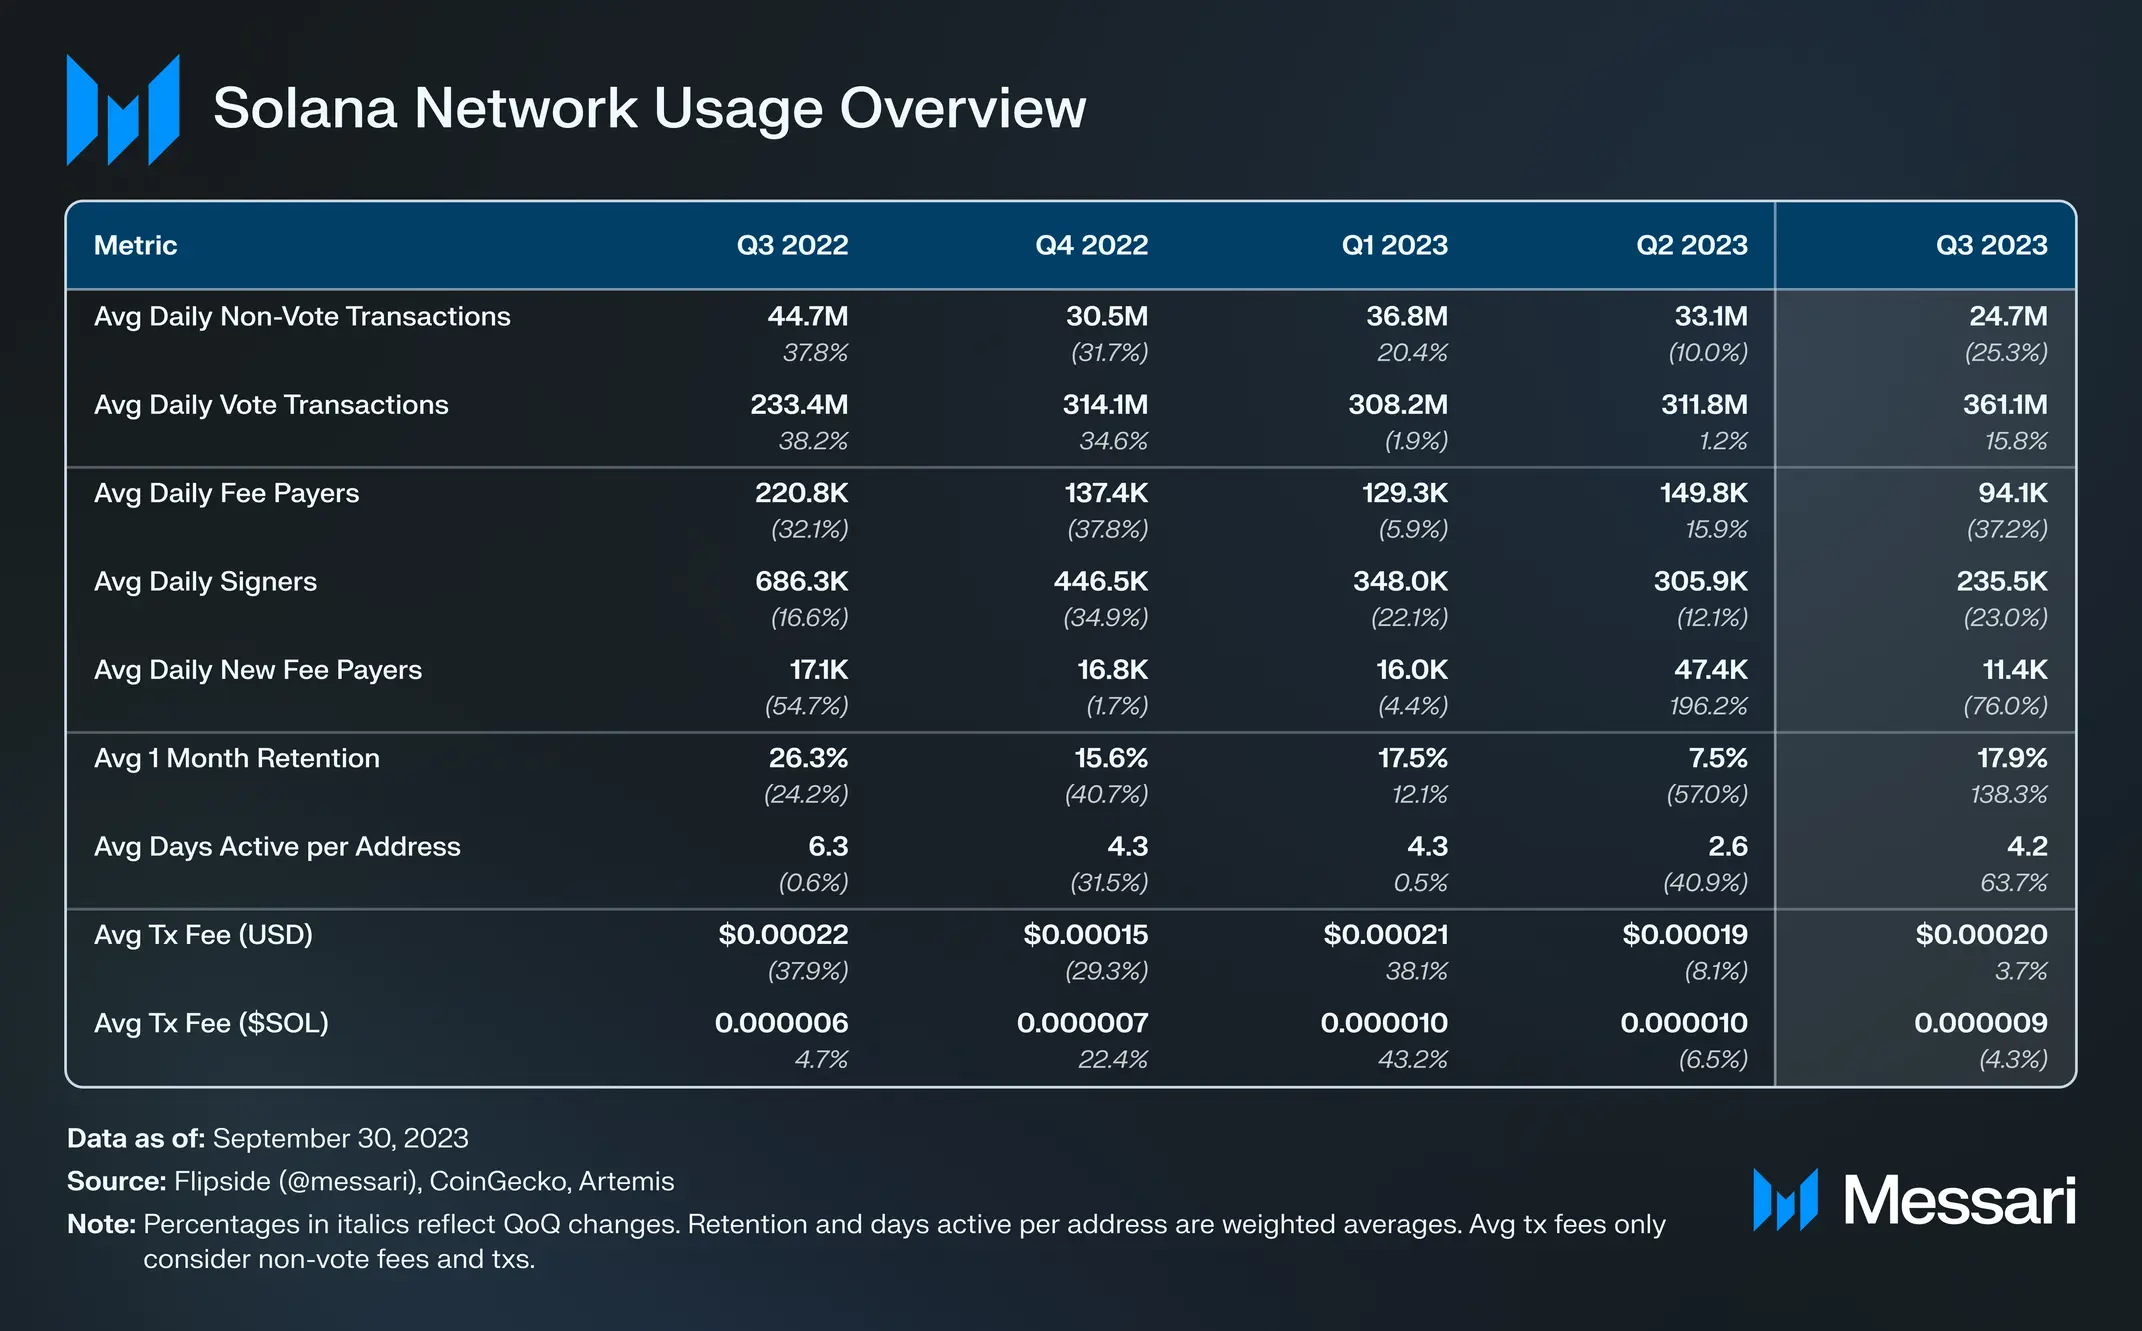
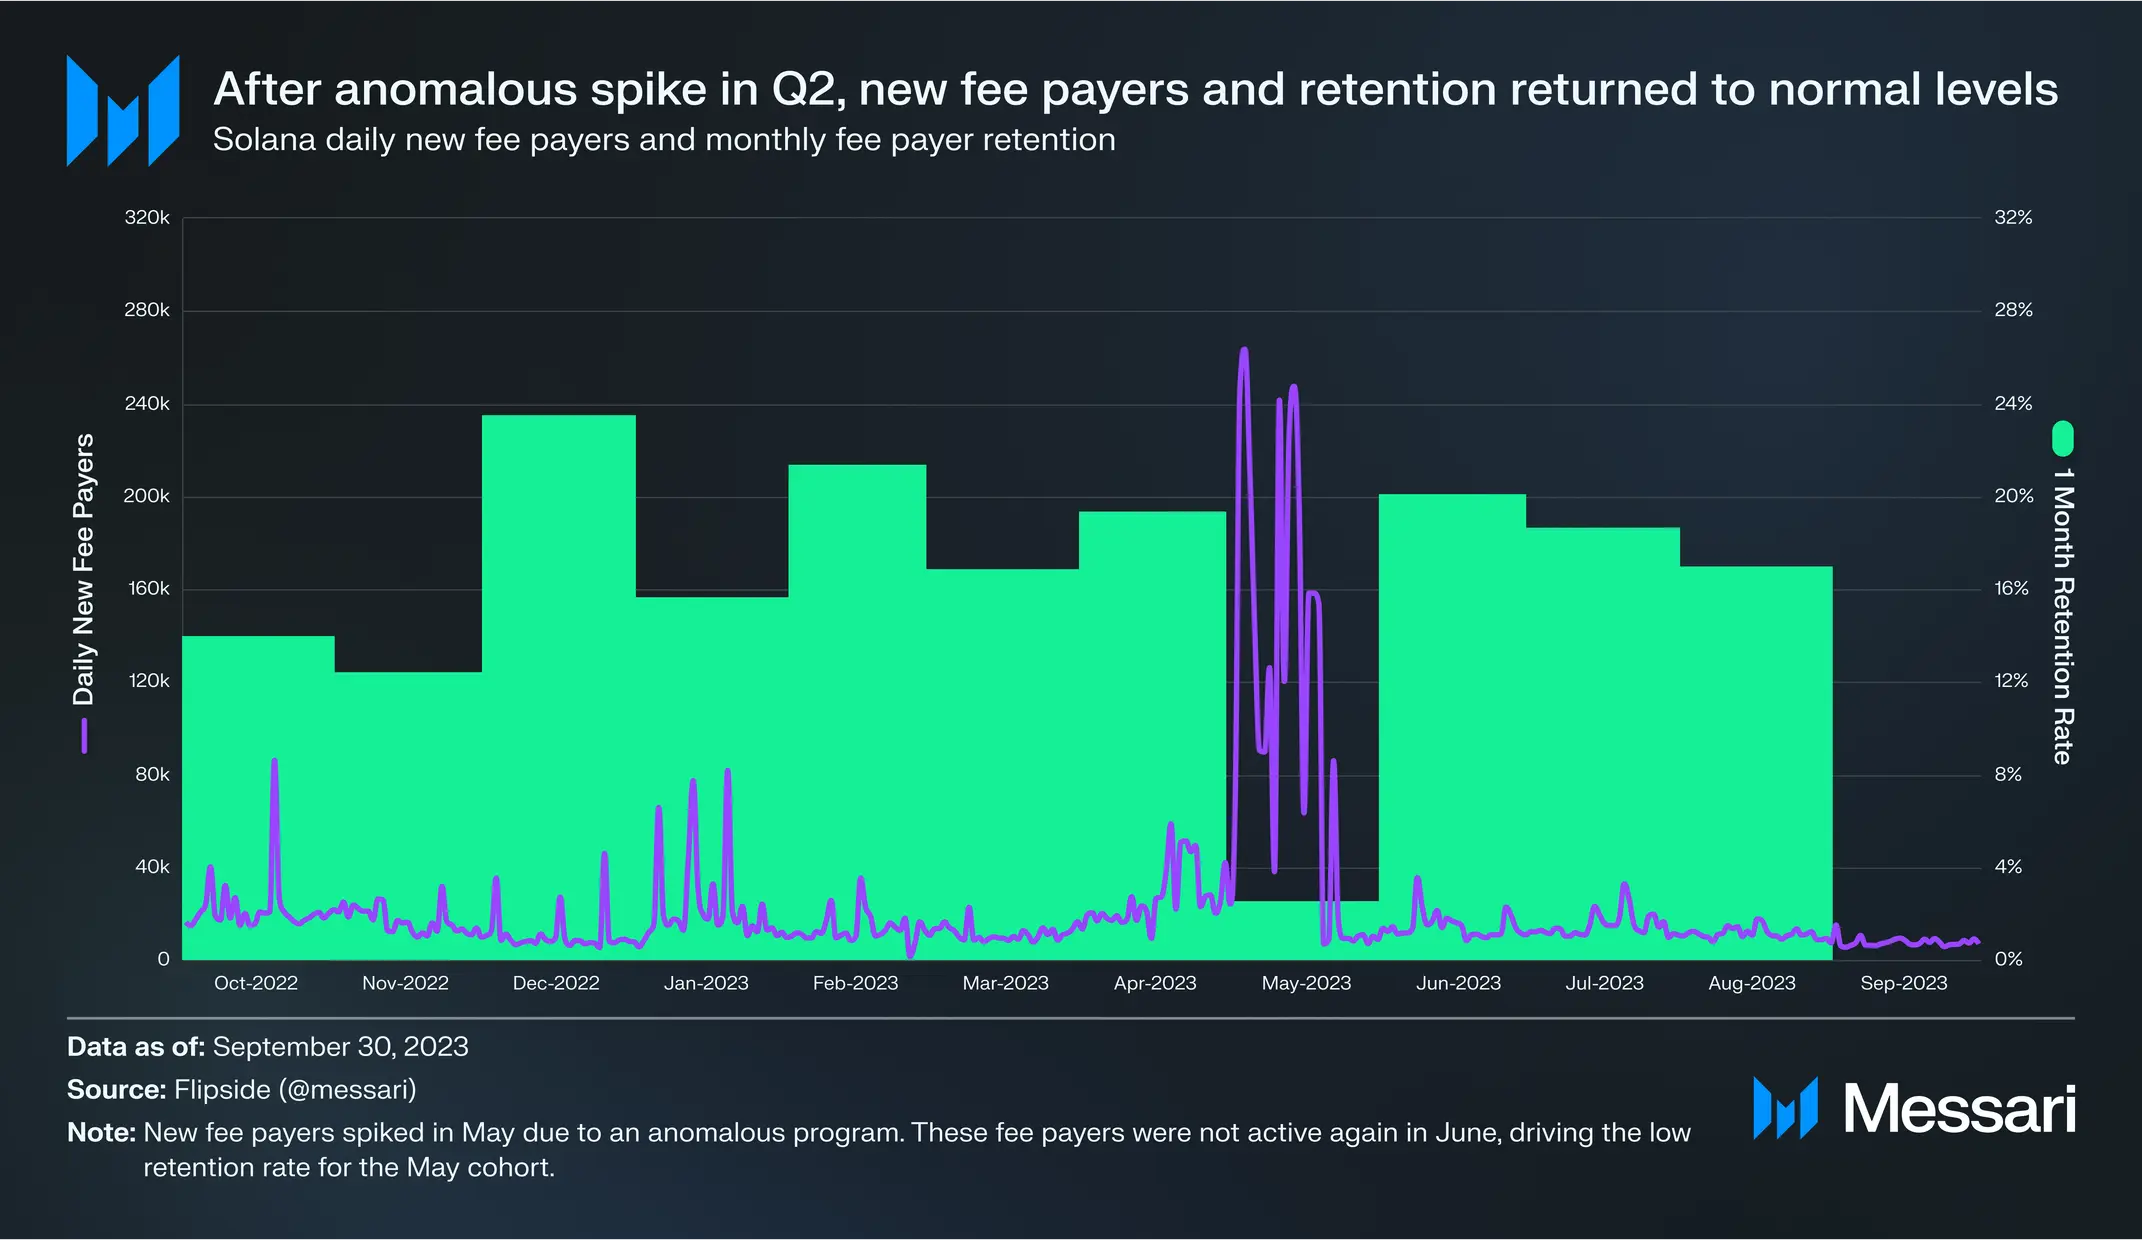
The average daily number of new fee payers decreased more dramatically QoQ, falling by 76% to 11,400. The figure was higher in Q2-2023, and that was because of an unusual activity from an unidentified application that generated a large number of new addresses in mid-May.
With the exception of the May cohort, the average one-month retention rate for Q3-2023 was 17.9%, which was consistent with the average rate from 2022.
Solana’s transaction fees were among the most consistent and affordable throughout the last quarter. During that period, the average non-vote transaction fee was $0.0002. The Messari report also noted that the number of non-vote transactions with priority fees saw a decline during the last quarter.
Priority fees function with local fee markets to minimize network spam and keep a single popular contract from overloading the system.
Solana’s Security and Decentralization in Q3-2023
As per the report, the amount of staked SOL in Q3 was almost back to the figures recorded before FTX’s collapse. The number of staked SOLs in Q3 was up 2% to 404.9 million. In addition, Solana, at $8.2 billion, came in second place behind Ethereum in terms of total staking market cap.
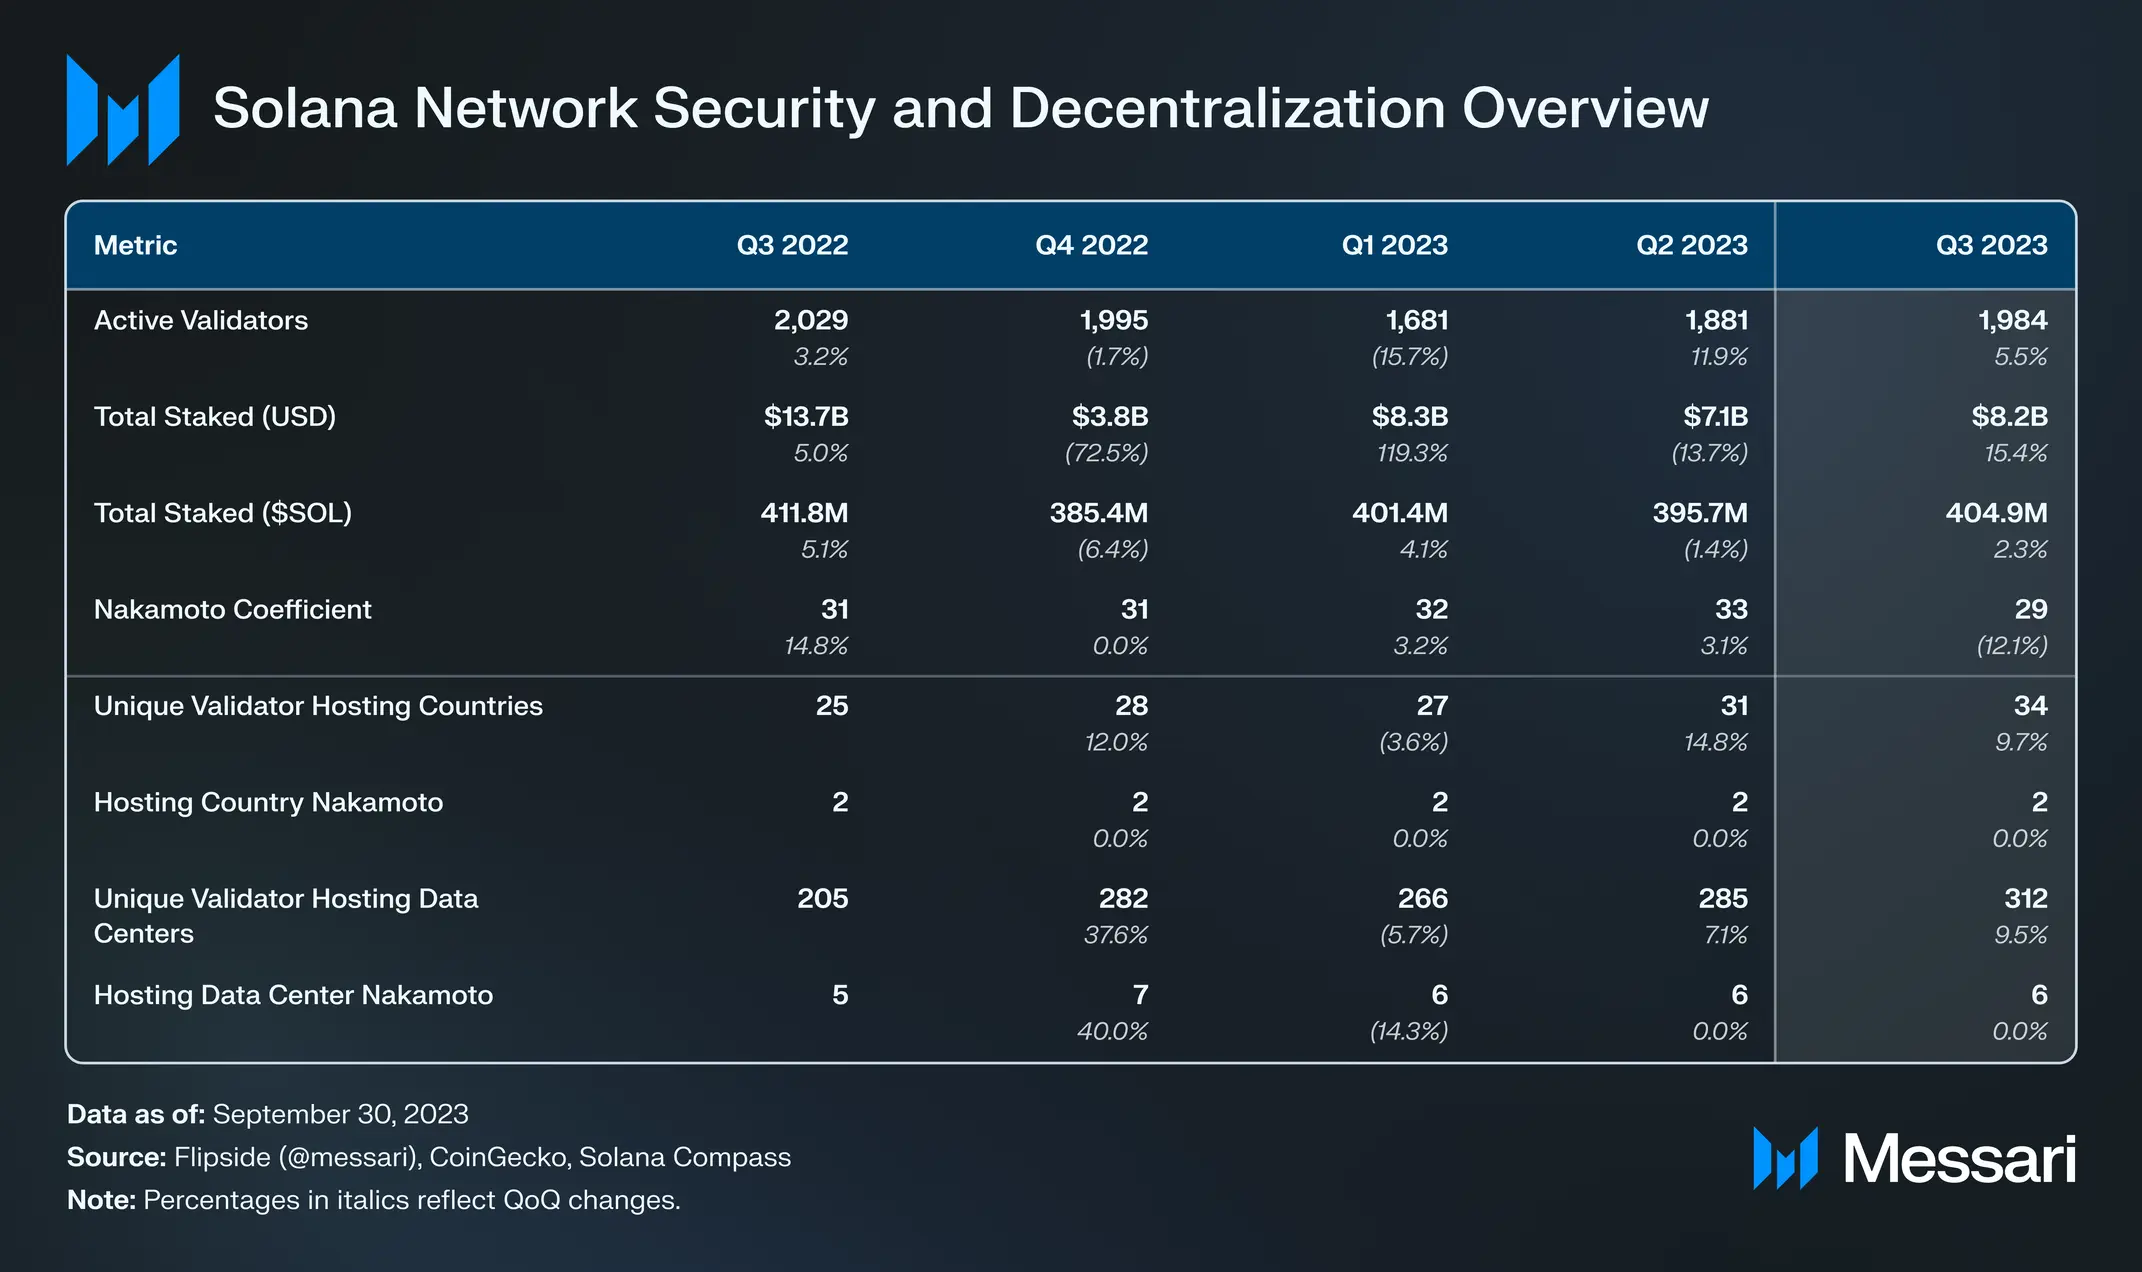
Solana’s Nakamoto coefficient dropped 12% QoQ to 29. However, it is one of the leaders in the sector. The Nakamoto coefficient is simply the minimum number of nodes needed to stop the network or break liveness. We can also measure it across other areas necessary to the resilience of a validator network, including the distribution of stake by location, hosting provider, and clients. So, the greater the Nakamoto Coefficient is compared to the number of validators or nodes, the more decentralized the network.
Solana’s Validator Growth in Q3-2023
The number of validators rose moderately to 1,984 (up 5.5% QoQ). The Solana Foundation stated in its October validator report that it intends to make changes to its delegation scheme to promote higher node quality as opposed to just quantity. The delegation program includes more than 73 million SOLs.
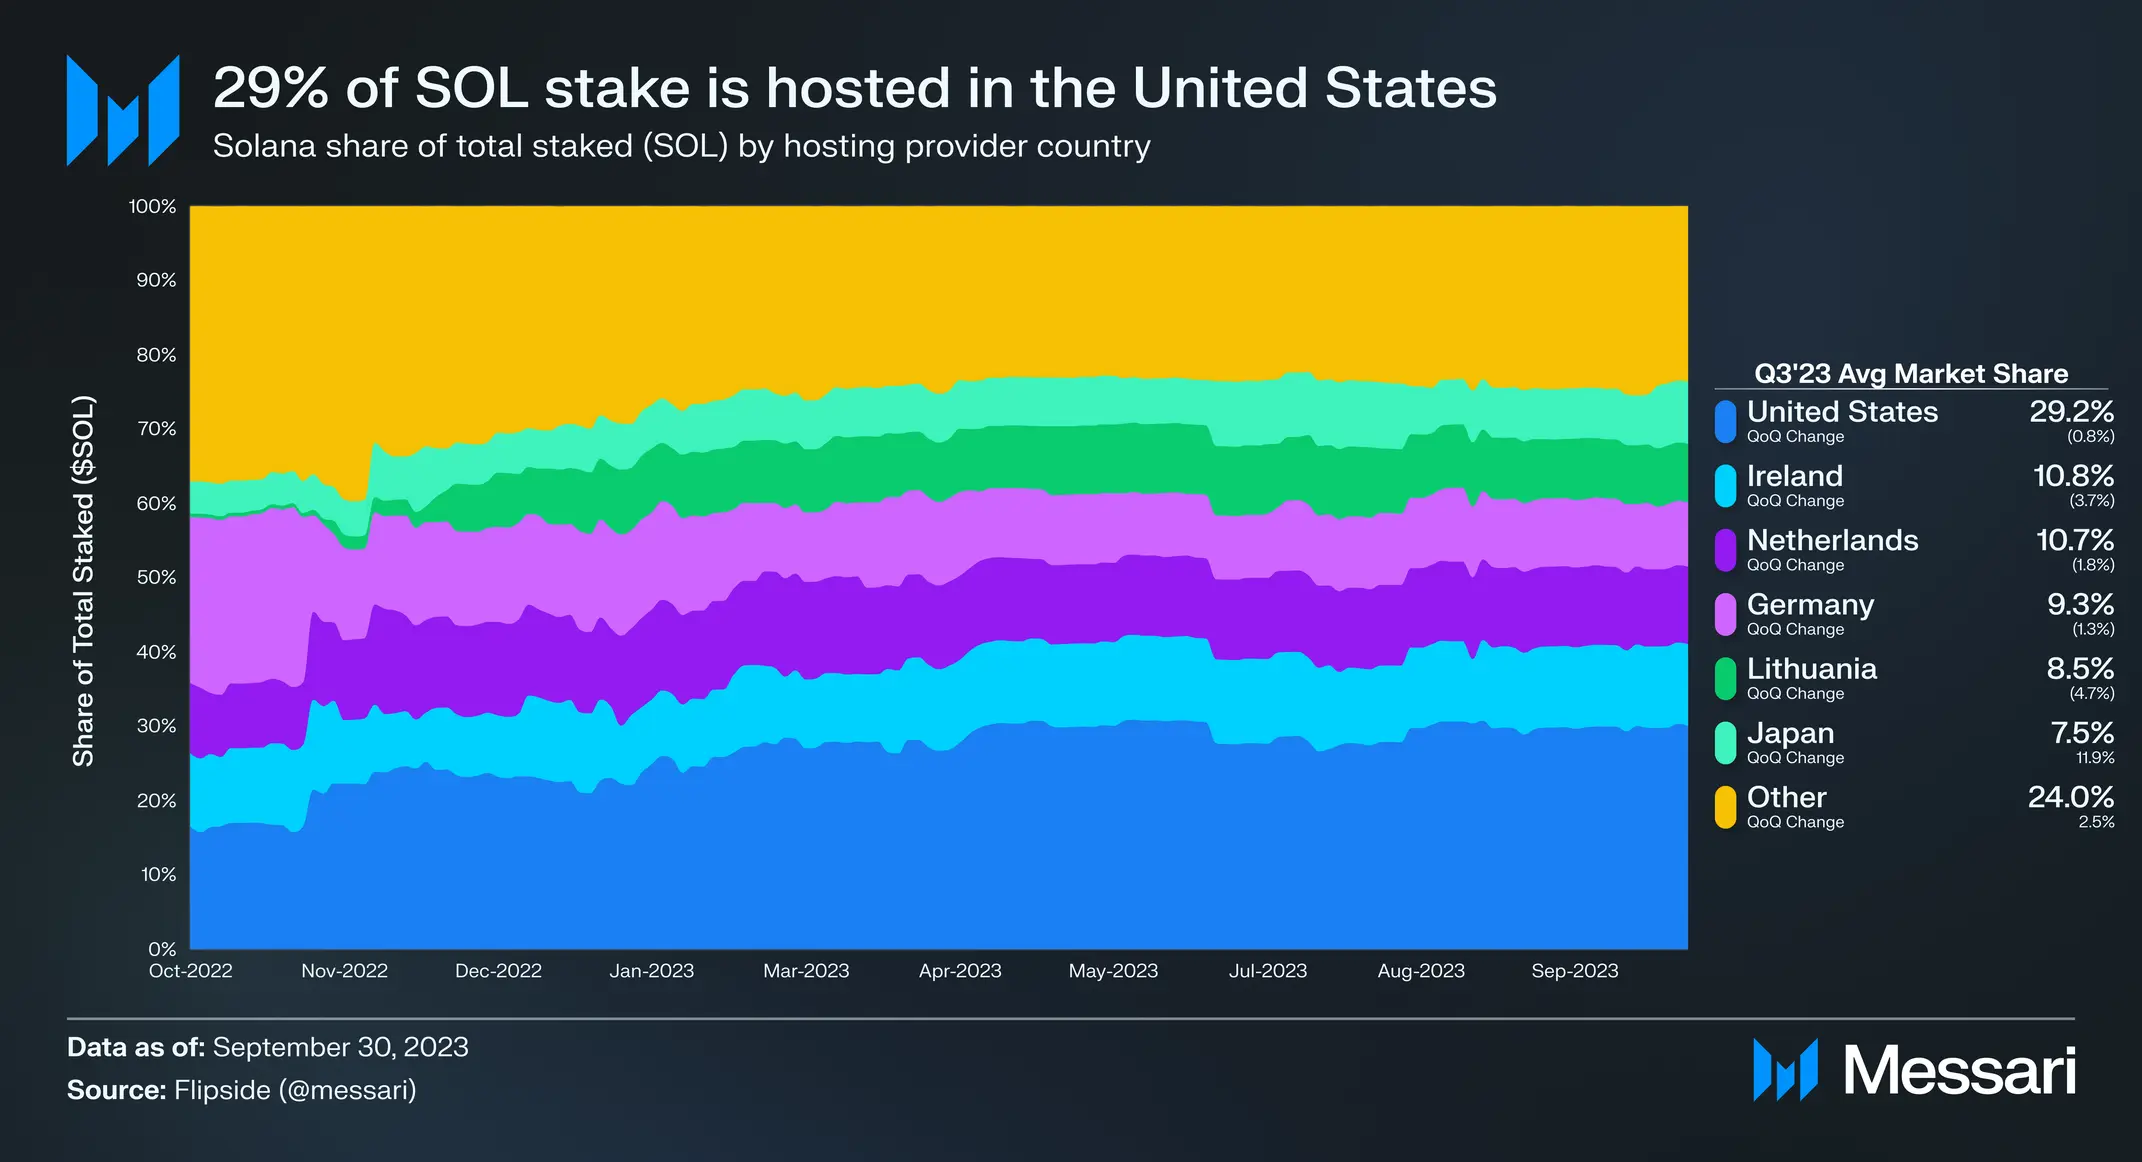 The report further states that there are Solana validators in 34 countries, up 27% YoY and 10% QoQ. Interestingly, the US has 29% of all stakes, leading the pack.
With 29% of the total investment, the US is in the lead. This gives Solana a geographic Nakamoto coefficient of 2, slightly below the 33.3% cutoff.
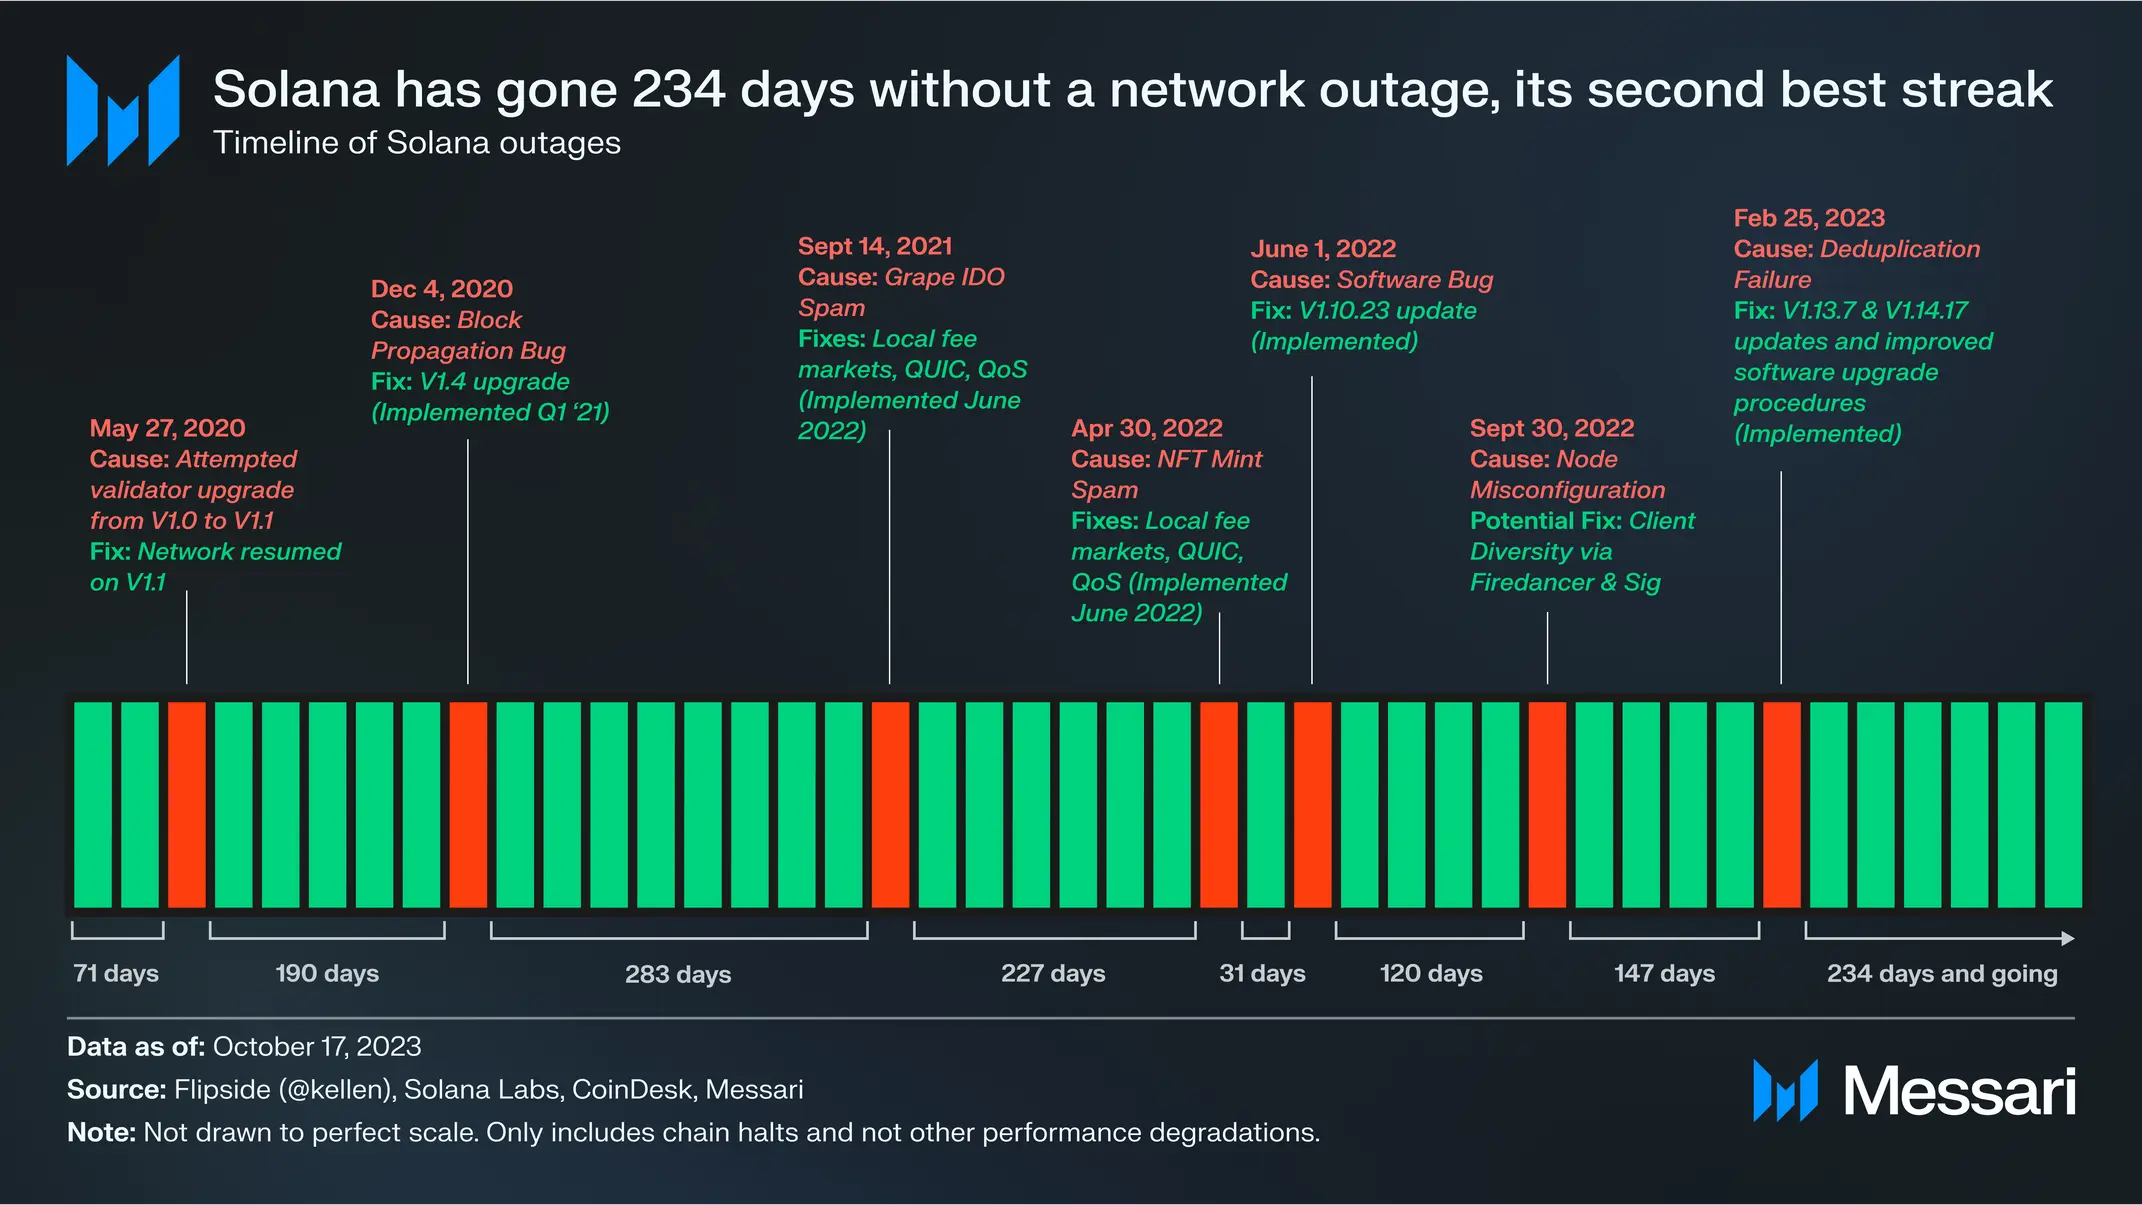
Solana’s last network outage was on February 25th. The network has stayed online since then. And it is getting close to reaching an all-time high in terms of days since an outage.
This report offers key insight into Solana’s resilience over the last quarter. We have a second part of this analysis coming up shortly. But as of this writing, SOL trades at $29.70. This is the second part.
Disclaimer
The information discussed by Altcoin Buzz is not financial advice. This is for educational, entertainment, and informational purposes only. Any information or strategies are thoughts and opinions relevant to the accepted levels of risk tolerance of the writer/reviewers, and their risk tolerance may be different from yours.
We are not responsible for any losses that you may incur as a result of any investments directly or indirectly related to the information provided. Bitcoin and other cryptocurrencies are high-risk investments, so please do your due diligence.
Copyright Altcoin Buzz Pte Ltd.


