


")


 Tokens Playing This P2E Game")
")
Last week, the value of Bitcoin fell below $26,000 due to reduced market activity. The escalating turmoil in China’s real estate industry, and news that SpaceX had divested a portion of its Bitcoin holdings.
This decline marked the most challenging week for Bitcoin since November of the previous year. Consequently, it instigated a widespread drop in altcoins and liquidations exceeding $1 billion. Notably, even MicroStrategy Inc., the primary corporate holder of BTC, now faces an unrealized deficit surpassing $600 million. Let’s dive in!
Macro Scene
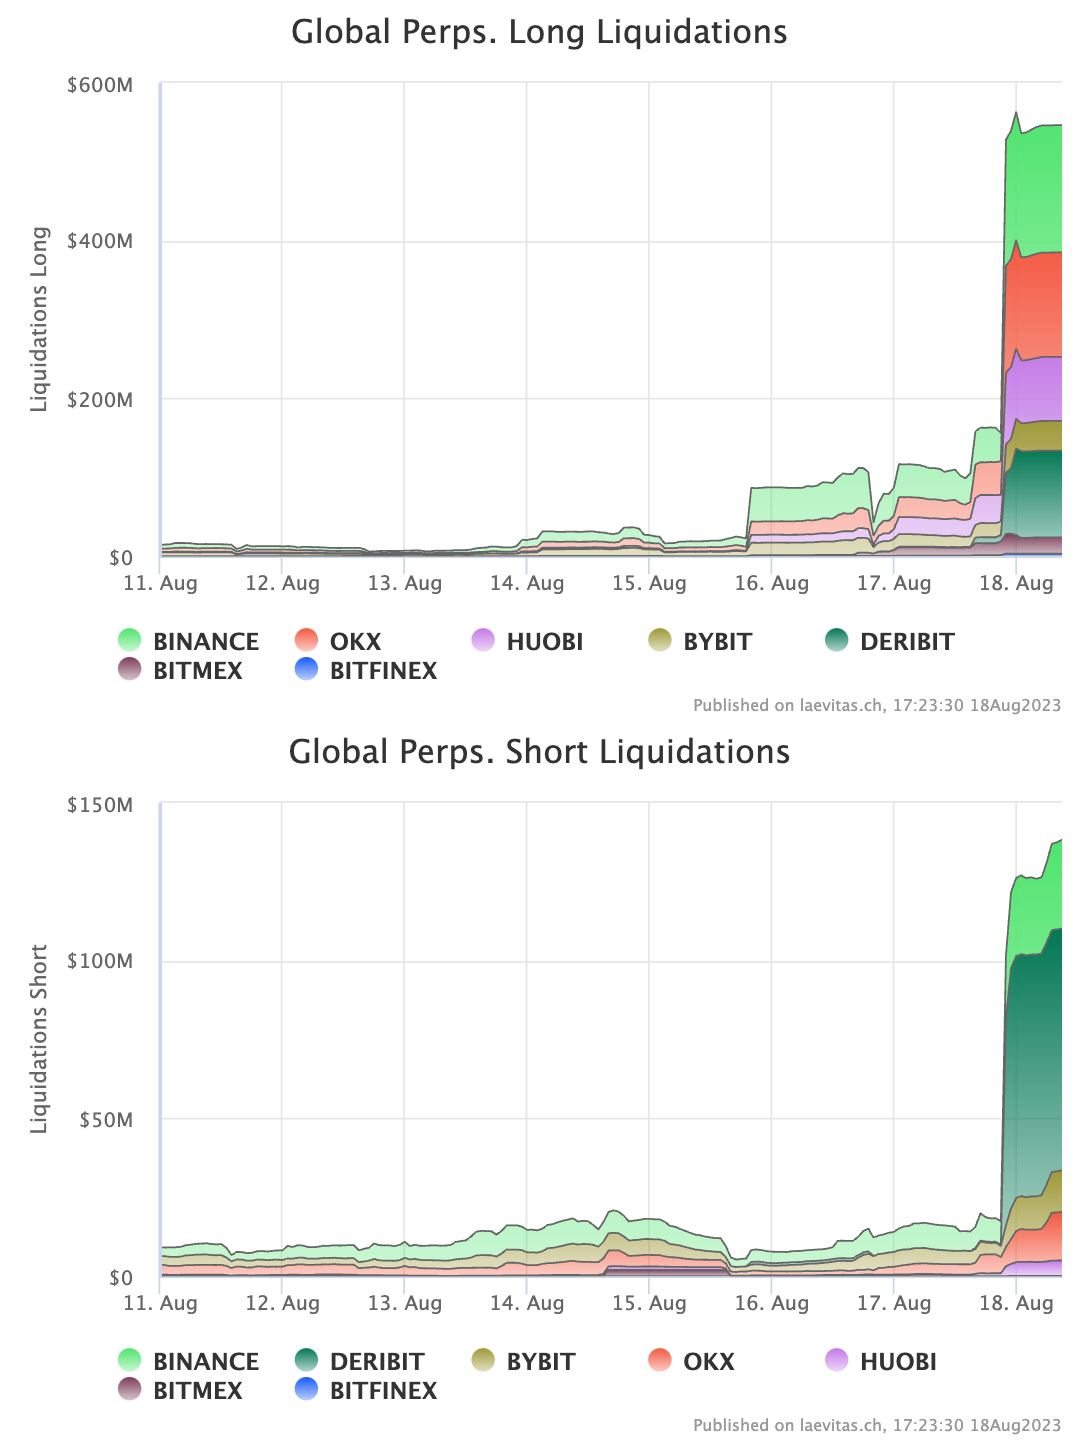
Last Thursday, the crypto market nosedived, leading to liquidations totaling approximately $1 billion and causing the overall market capitalization of cryptocurrencies to revert to $1.1 trillion. So, the succession of liquidation events in derivatives markets accounted for a disproportionately significant portion compared to relatively subdued spot selling.
Moreover, the cumulative scale of these liquidations paralleled those encountered just after the FTX debacle, a moment that led BTC/USD to touch a nadir of $15,600 in November 2022. This occurrence implies the diminishing liquidity that has characterized markets in recent weeks.
Source: QCP Capital
Simultaneously, the stock market has been grappling with several adverse developments: China’s deflationary situation, bank downgrades, resurging inflation, and more.
Potential for a New Downward Trend
While it remains premature to make definitive predictions, there’s a possibility that we are teetering on the edge of another downward trend. The forthcoming week or two will be pivotal in determining this trajectory. Should cryptocurrencies endure another 1-2 weeks marked by substantial downturns, it could substantially disrupt the sustained upward momentum observed since the year’s commencement.
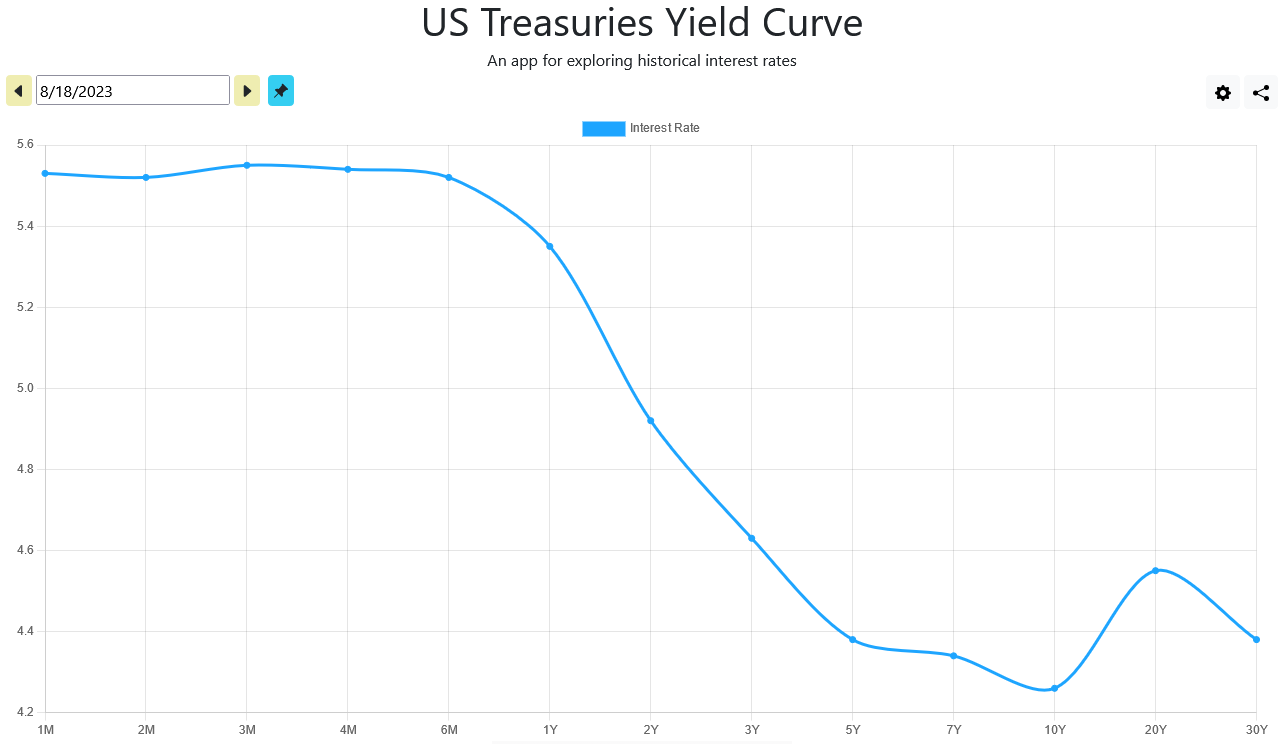
Naturally, such a scenario would be conspicuous to all market participants, potentially elevating the chances of a significant recovery rally. Projecting the subsequent week’s price movements hinges on comprehending the underlying cause of the sudden downturn in the cryptocurrency market. The catalyst behind this scenario is most likely the behavior of the US Treasury Yield Curve.
Effects on Sustained Yearly Uptrend
Essentially, the stock market seems to have a distinct aversion to long-term interest rates surpassing the 4% mark, particularly concerning 10, 20, and 30-year US bonds. Many potential explanations exist for this phenomenon, ranging from companies struggling to accommodate these elevated rates to banks grappling with unrealized losses that restrict their capacity for new lending.
Besides, rating agency Fitch has warned about the possible downgrading of numerous banks. Including prominent institutions like JPMorgan, exacerbating the challenges faced by the banking sector. This period has witnessed a series of substantial setbacks for banks, marked by failures and compelled mergers.
Jackson Hole Conference and Fed’s Position
On a tangential note, the upcoming Jackson Hole conference, a pivotal gathering of the affluent elite, is scheduled for August 25th. This event will exert considerable influence on the Federal Reserve’s subsequent conference in September, which will address interest rates and the state of the US economy.
Noteworthy insights from the Fed indicate a resurgence in inflation, yet Powell is keen on avoiding a 3% core inflation threshold and intends to maintain low rates until 2025. However, the Fed is grappling with internal divisions. One faction contends that the economy is already too impaired, while others advocate raising the current 5.5% interest peak to 6%.
If the Jackson Hole conference proves valuable and prompts the Fed to consider the global and domestic impact, there might be room to contemplate a 3% core inflation scenario. Failing this, it’s conceivable that more covert bank mergers could ensue.
Yet, the larger inquiries revolve around the factors propelling the ascent of longer-term interest rates and how this phenomenon might be spilling into the cryptocurrency market.
The reasons behind the surge in long-term rates are not closely tied to expectations of heightened inflation or an unexpectedly robust response of interest rates to inflation. It is because inflation itself continues to decline.
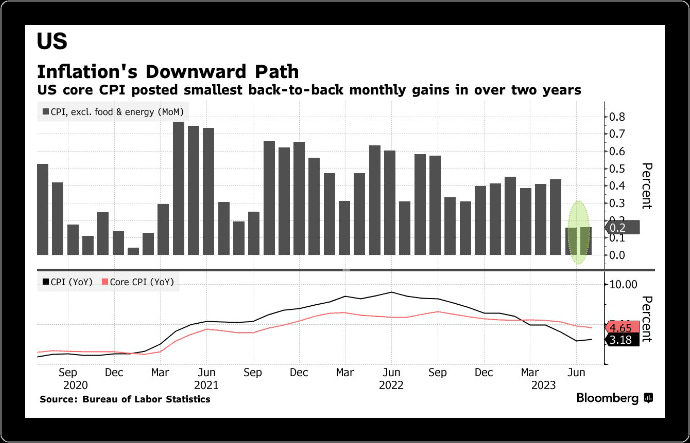
Source: Bloomberg
China’s Role and Its Economic Impact
It leaves us with another significant factor to consider, China. As you might have noticed, the Chinese yuan has steadily depreciated against the US dollar. Given that the recently appointed governor of the Bank of China has taken measures to support the yuan, it is highly plausible that the Chinese government has been offloading US government debt in exchange for USD to bolster the RMB.
The act of selling US government debt drives up interest rates for those specific debt durations. China is not alone in this endeavor, as the US government itself has commenced the issuance (sale of new debt) to replenish its reserves at the Federal Reserve. A recent auction of longer-term US debt reportedly encountered challenges, leading the US government to offer higher yields.
Spillover Effect on Crypto Market
Examining how this dynamic might affect the cryptocurrency market reveals a straightforward connection. Prominent investors who hold both equities and cryptocurrencies are likely to liquidate their more successful assets (cryptos) to manage their financial obligations related to stocks (such as leveraging) and the broader economy (such as loans). The decision by SpaceX to sell BTC could be indicative of this pattern.
Likewise, cryptos’ prevailing regulatory uncertainty might motivate institutional investors to secure profits. Recent events such as the Federal Reserve’s caution to banks collaborating with stablecoins, including KYC provisions in the Defense Bill, and significant market makers scaling back their involvement in the industry have collectively contributed to investor apprehension.
Long-Term Interest Rates and Possible Scenarios
Assuming this hypothesis holds, the crypto market’s decline might continue until stability returns to the stock market or, more specifically, until longer-term interest rates dip below the 4% threshold. Achieving this might necessitate a triggering event, such as a conflict, prompting investors to seek refuge in secure assets like US bonds.
Regrettably, any event that prompts a flight to safety would likely also prompt a sell-off of risk assets like cryptocurrencies. The only other avenue for a decline in long-term interest rates is the Fed’s initiation of quantitative easing (QE). But what is QE, and what is its significance?
Quantitative easing involves a central bank, like the US Federal Reserve, acquiring securities from the open market to lower interest rates and augment the money supply. This approach generates fresh bank reserves, providing heightened liquidity to banks and fostering lending and investment. In the US, the Federal Reserve administers QE policies.
Without such measures, the prospect looms that both crypto and stocks could sustain their downward trajectory. The ray of hope lies in the realization that the US government’s ability to sustain these interest rates over an extended period is limited. Eventually, adjustments will need to be made.
ETH Futures ETF Is On The Way!
While the SEC’s deliberation on approving a Bitcoin spot ETF remains sluggish, a recent Bloomberg report, citing reliable sources, indicates that the agency is poised to pave the way for numerous Ethereum futures-based exchange-traded funds (ETFs).
Approximately 12 companies are seeking approval for an ETH ETF, with well-known entities like Bitwise, ProShares, and Volatility Shares among the applicants. These proposed ETFs would derive from futures contracts and would not directly expose investors to ETH spot holdings. It’s worth noting that Bitcoin futures ETFs have been operational since 2021.
While the potential approval of an Ethereum futures ETF bodes well for the industry, analysts view it as a step in a more incremental direction for regulators. Nevertheless, they are still closely monitoring the progression of the Bitcoin spot ETF approval process, recognizing its potential impact.
In a related development, Coinbase secured approval last week to initiate crypto futures trading within the United States.
SBF And $100M Political Donations From Stolen Funds
Although SBF is in jail, the legal proceedings concerning his upcoming trial are still unfolding vigorously. In the previous week, a fresh indictment was lodged by the U.S. Department of Justice, alleging that SBF orchestrated political contributions exceeding $100 million using misappropriated customer funds.
The DOJ document highlights that these contributions were aimed at both Democrats and Republicans, intending to influence cryptocurrency regulation. Bankman-Fried exhibited notable political engagement during the 2022 midterms, channeling approximately $27 million into the super PAC “Protect Our Future,” primarily channeling funds toward Democratic legislators.
During an interview, SBF later disclosed that he had also donated a similar amount to Republicans, albeit in a more discreet manner to avoid public scrutiny. Now, let’s move to on-chain data.
Declining Crypto Volatility
Throughout August, crypto markets have experienced a continued slide in volatility, contributing to a period of stagnation. However, upon closer examination, this decrease in volatility has been a consistent trend over the past two years. Notably, occasional spikes have punctuated this trend, driven by events like the Terra and FTX collapses.
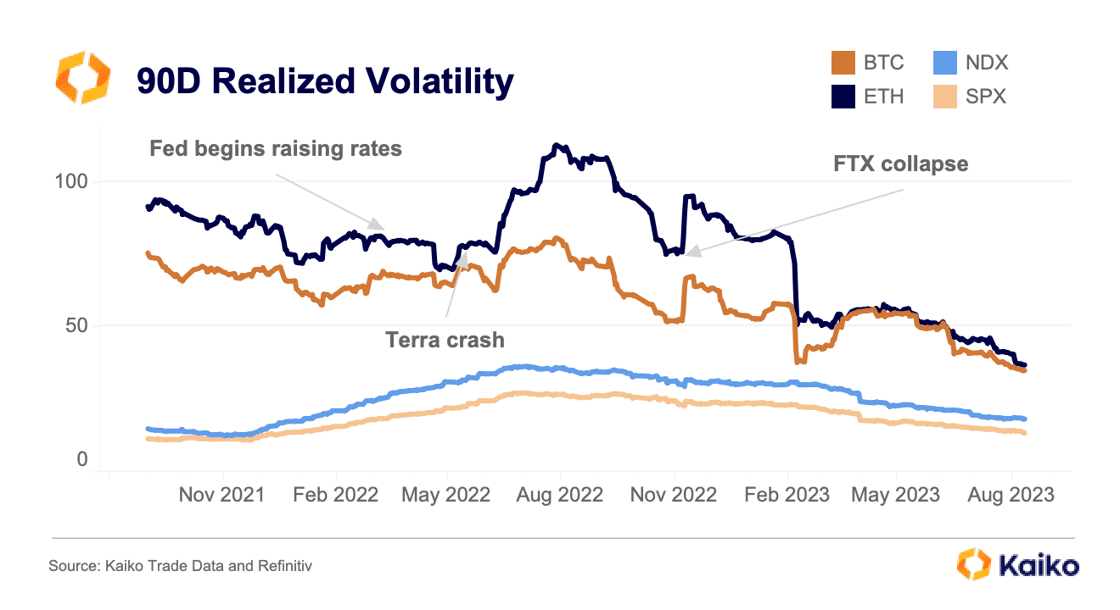
Source: Kaiko
An intriguing observation is the near absence of a significant gap between BTC and ETH volatility. Historically, BTC has been more volatile than ETH, but the current similarity in volatility levels suggests a shifting dynamic in the market.
Interestingly, even impactful events, such as the mid-June news about BlackRock’s application for a spot BTC ETF, which could be a substantial catalyst for unlocking new demand, failed to evoke a substantial increase in volatility.
U.S. Liquidity Challenges and International Exchange Trends
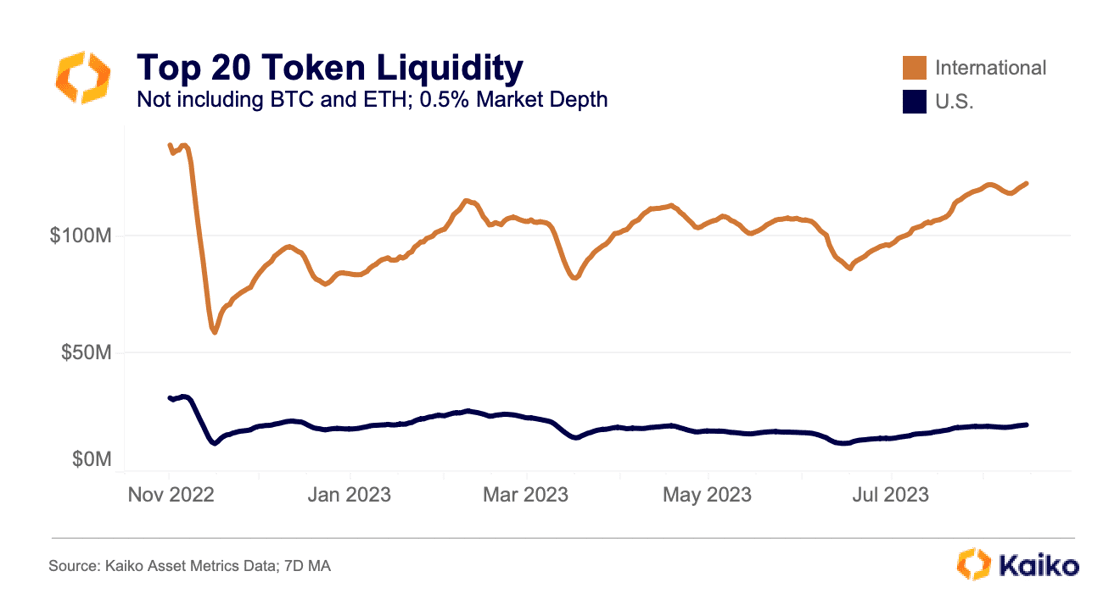
The impact of declining performance among major firms in the U.S. has had a clear ripple effect on liquidity. This situation is evident when examining the data. The chart below illustrates the 0.5% market depth of the top 20 non-BTC, non-ETH tokens, starting just before the collapse of FTX.
Source: Kaiko
When comparing liquidity trends, we can observe a significant surge in international exchanges, where liquidity has risen from $70 million to $120 million. This upward trajectory has persisted throughout the summer, nearly reaching pre-FTX levels.
In contrast, U.S. altcoin liquidity has faced challenges in its recovery journey. Despite a modest rally in the spring, SEC lawsuits targeting tokens alleged to be securities hindered this progress. Currently, U.S. altcoin liquidity stands at $20 million, a notable drop from the $32 million recorded in November 2022.
Complexities of Liquidity in CEXs and On-Chain
The liquidity landscape presents a nuanced scenario, with contrasting dynamics observed between CEX and on-chain platforms. While CEX liquidity exhibits a mixed picture, on-chain liquidity presents a more concerning outlook.
Source: Kaiko
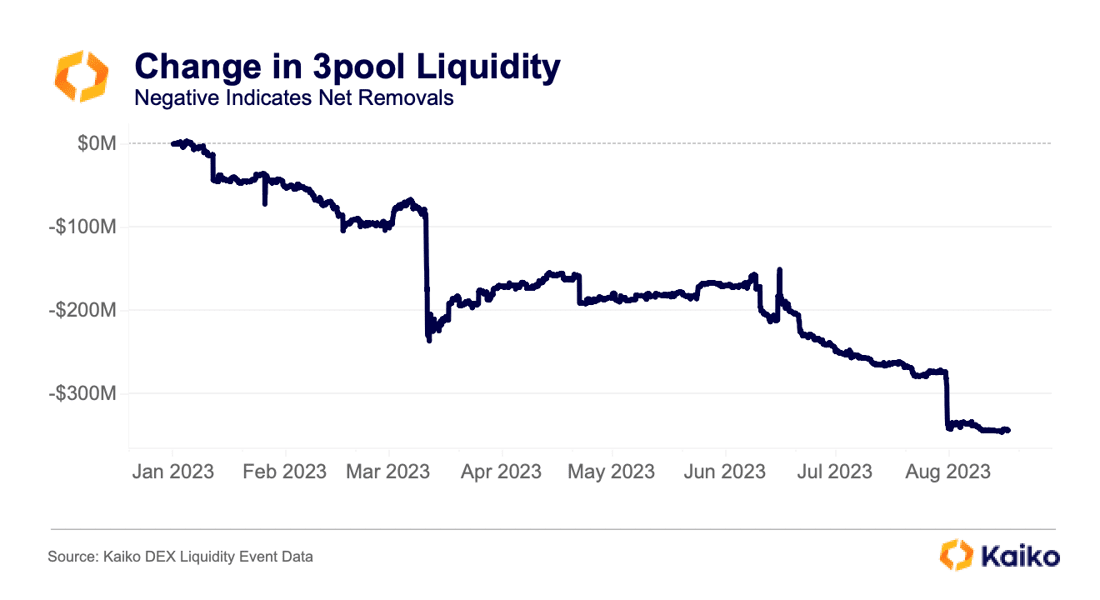
Traditional sources of on-chain liquidity, such as the 3pool, have faced consistent declines as trading volumes and associated fees have diminished. Notably, the 3pool has witnessed a substantial loss of nearly $350 million since the year began. This trend can be due to several factors.
Firstly, higher interest rates in TradFi have enticed users with appealing APYs exceeding 4%. Simultaneously, liquidity has become fragmented as users seek opportunities for higher returns. This situation has led to recent months being dubbed “On-chain Summer.”
Unlike the DeFi Summer of 2020, which saw a surge in Ethereum activity, this summer’s activity has spanned multiple blockchain networks. Networks like Solana are reemerging, Arbitrum’s influence persists, and Optimism has gained momentum, especially with the Base launch. As liquidity and trading volume shift between these networks in pursuit of better returns, the market dynamics continue to evolve.
Evolving Dynamics of Liquidity and Volume
Source: Kaiko
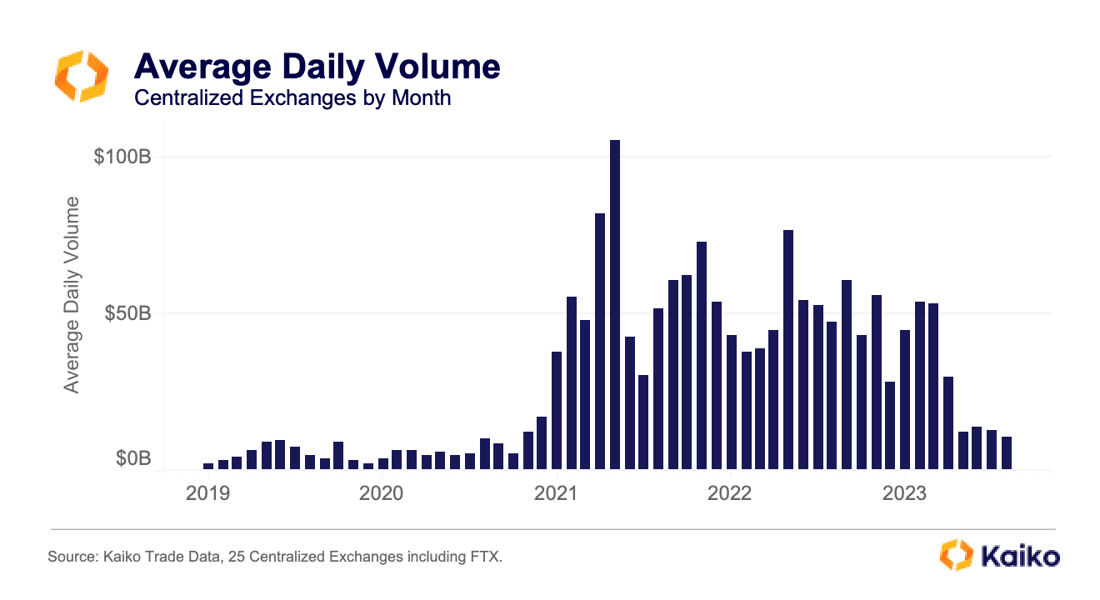
While international exchanges have seen improvements in liquidity, the landscape of spot volumes presents a different story. Over the last four months, average daily volumes have hit their lowest point since October 2020, when BTC traded at $10,000 and ETH at $350.
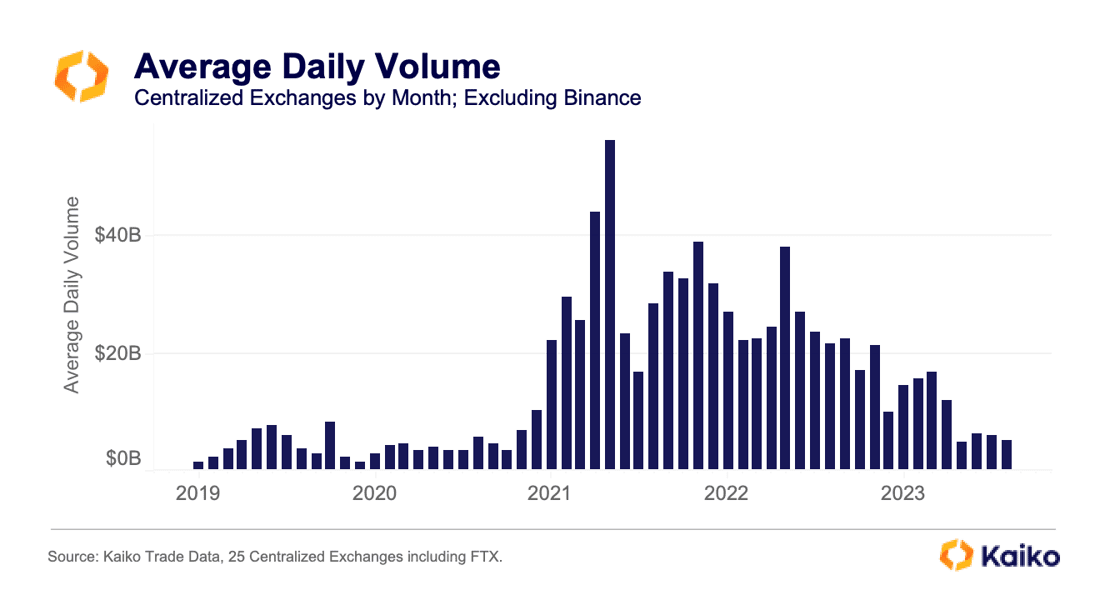
The apparent steep drop from April to May 2023 can raise concerns; however, by excluding Binance and Binance.US from the analysis to mitigate the impact of zero-fee promotions, the overall trend remains consistent.
Source: Kaiko
Volumes have been steadily declining since the Terra collapse, except for the initial three months of 2023, during which the crypto market saw a brief yet noteworthy recovery.
This context suggests that the recent months are not an isolated anomaly but an extension of the prevailing trend of diminishing volumes. This trend mirrors the evolving dynamics of volatility in the market as well.
Miners And Whales To Blame?
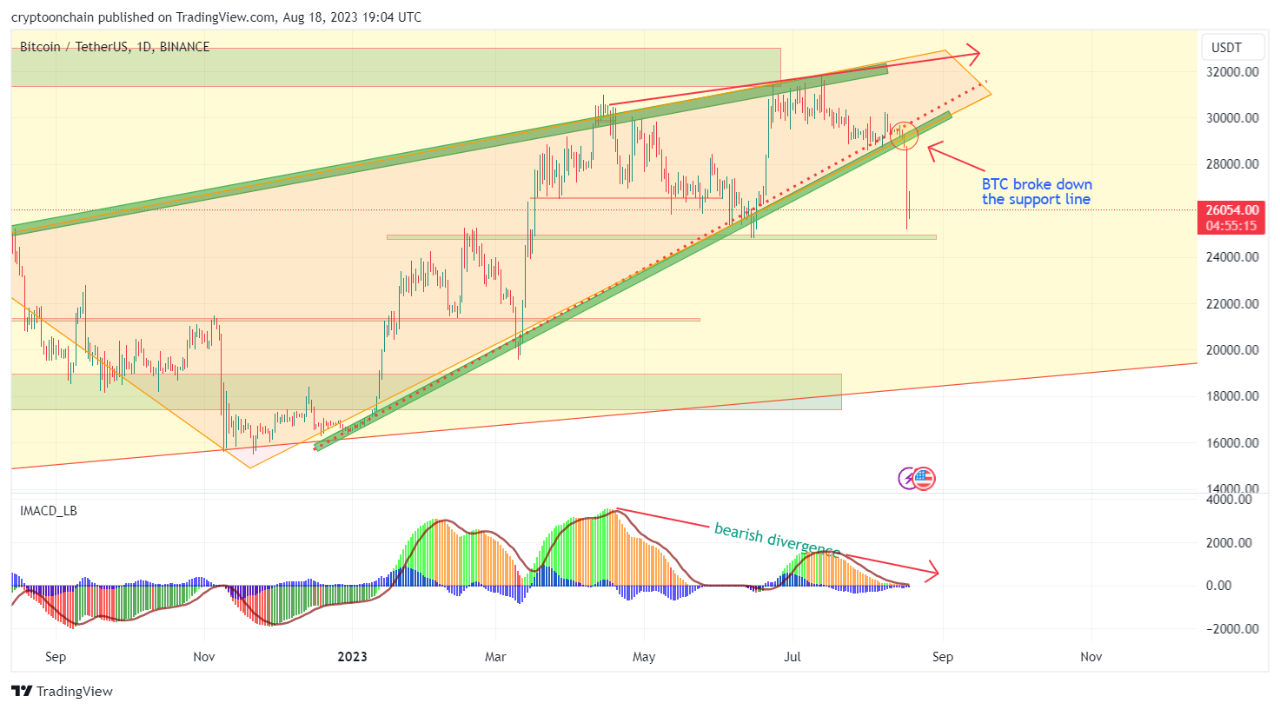
Source: CryptoQuant
Bitcoin has recently breached the support line on its technical chart, a significant development. Moreover, the breakdown of the wedge pattern adds further weight to this observation, potentially indicating the initiation of a bearish trend in the market.
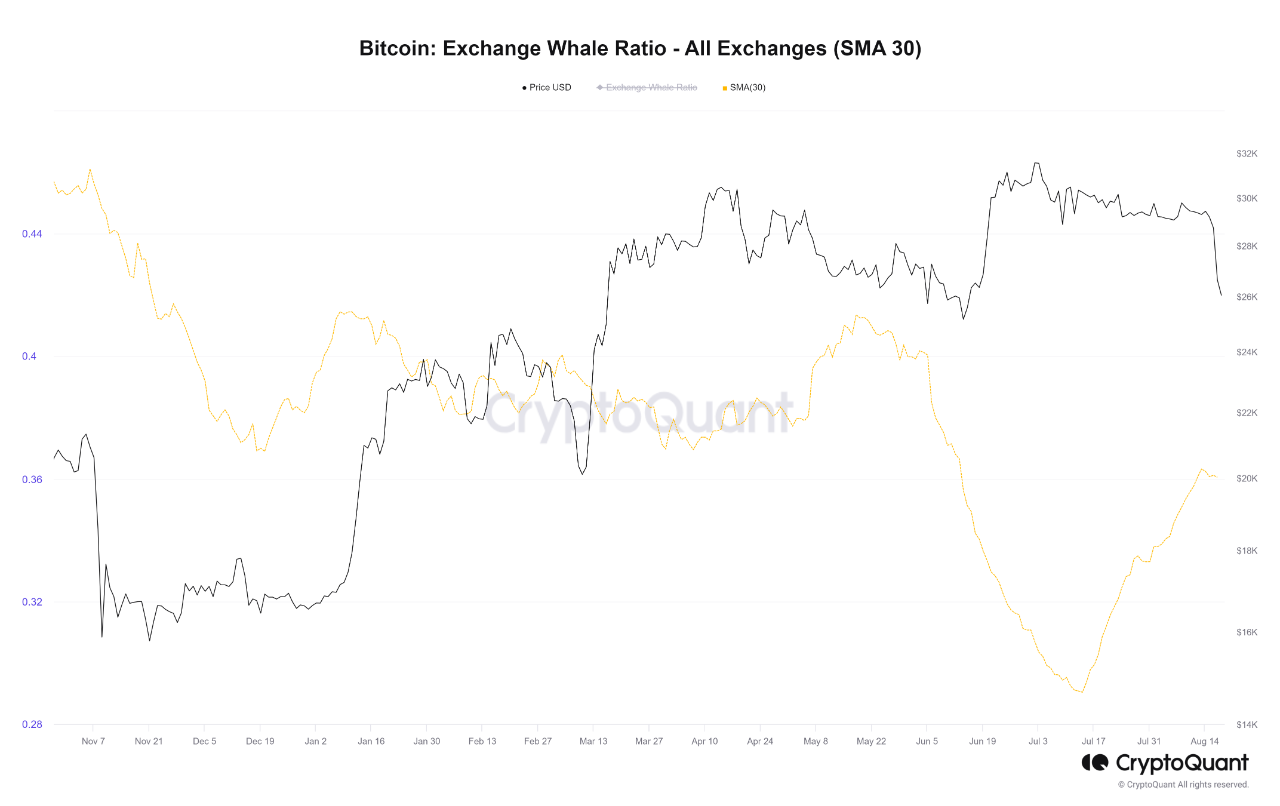
Source: CryptoQuant
Analyzing the on-chain charts provides additional insights. The rise in the Bitcoin Exchange whale ratio suggests that larger holders are under increasing pressure to sell their holdings, adding a layer of selling pressure to the market dynamics.
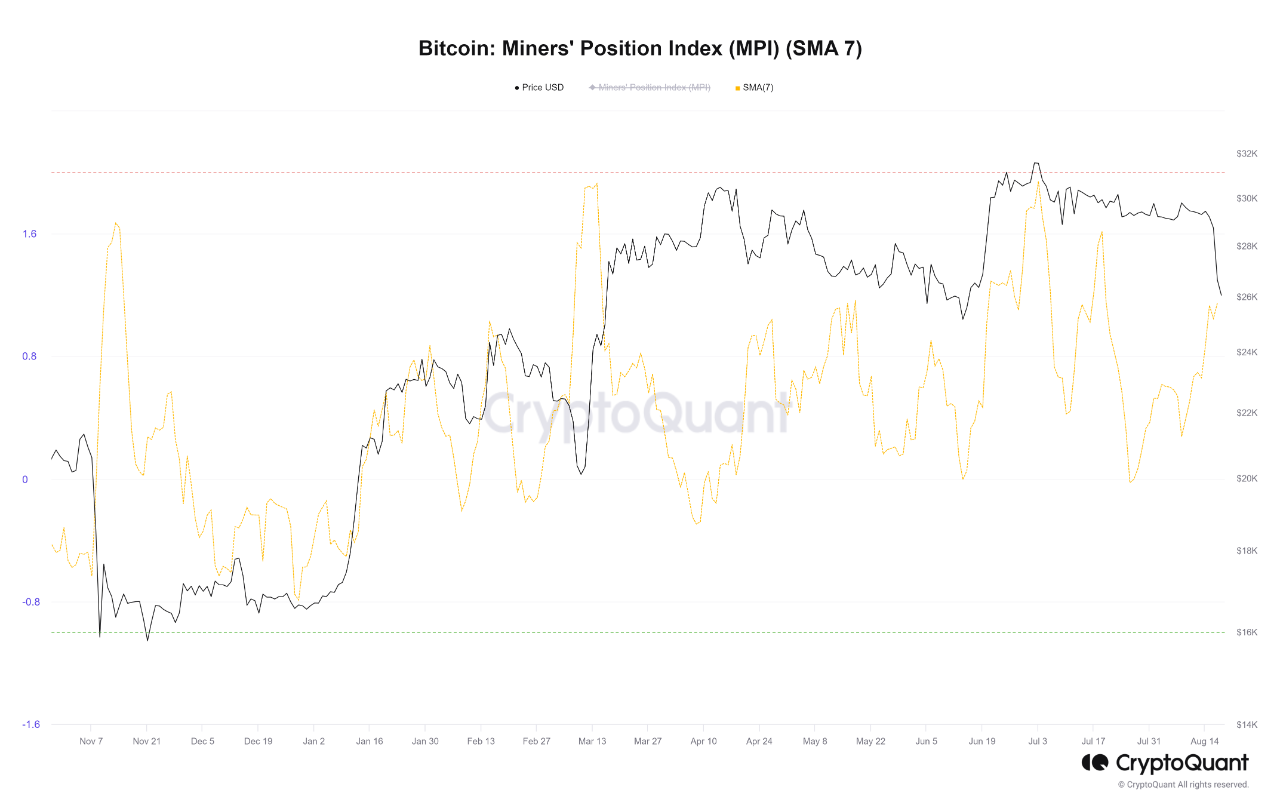
Source: CryptoQuant
Besides, the Miner Position Index (MPI) reveals a heightened selling inclination among miners. These findings align with the signals from the technical chart, collectively suggesting the potential continuation of the downward trend in the foreseeable future.
How Critical Is The Current Market Downturn?
Let’s thoroughly analyze the prevailing market conditions by drawing insights from Bitcoin’s previous price cycles. This assessment focuses on the realized price of both short-term and long-term holders of Bitcoin.
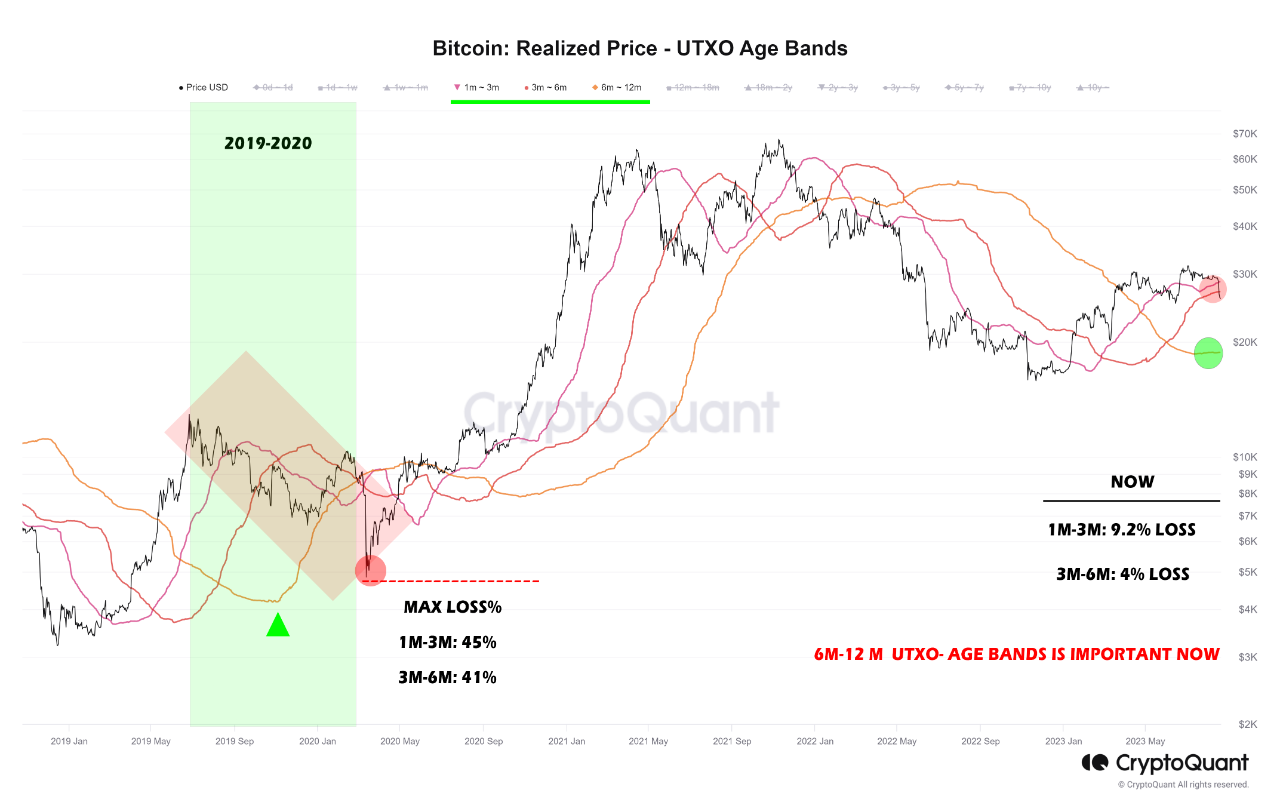
Source: CryptoQuant
The provided image offers a comparative view between the 2019 cycle and the ongoing cycle. It juxtaposes the realized price of Bitcoin held for 1-6 months and those held for up to 1 year. Additionally, it estimates the maximum pressure or short-term loss in both cycles.
During the 2019-2020 cycle, the market experienced a significant shock due to the global spread of the Coronavirus. Short-term holders of Bitcoin (1-6 months) faced a maximum loss of about 40-45%, a contrast to the current scenario where the loss ranges between 4-9%.
We can focus on the Bitcoin holders within the 6-12 months range to establish a meaningful comparison benchmark. This timeframe offers a comprehensive perspective for evaluating the Bitcoin market over a year.
Two Primary Aspects Stand Out
- The ratio of the realized value price of Bitcoin held for up to a year compared to the prevailing market price: Is it indicating profit or loss?
- How many Bitcoins have reached the 1-year maturity mark in this price cycle? In essence, has the price performance of Bitcoin prompted a shift towards a longer-term investment outlook?
In the current market context, it is crucial that despite potential further price declines, the realized value of Bitcoin increases. Such an increase signifies a dual incentive for holding Bitcoins: overcoming short-term losses and fostering longer-term holding.
The trajectory of this average price, which is currently stable, must show an upward trend in the upcoming months. It would ensure that the dominance of Bitcoins held for up to a year contributes to maintaining Bitcoin’s long-term bullish performance. Failure to witness this progression could foreshadow a significant price downturn.
Insights from Exchange Inflow – UTXO Age Bands
The recent dip in Bitcoin’s price marked a significant breach of a major support level linked to the realized price of short-term holders. This pivotal threshold serves as a crucial indicator for assessing the profitability status within the portfolios of short-term Bitcoin investors.
However, attributing the panic-driven selling solely to these short-term holders demands a more nuanced examination, necessitating an insightful analysis of exchange inflow through the lens of UTXO (Unspent Transaction Output) age bands.
But what exactly is the Exchange Inflow indicator?
The Exchange Inflow – Spent Output Age Bands indicator is a compass for tracking selling behavior in the Bitcoin market. It classifies spent outputs based on the time since their creation, illuminating the movement of these outputs into exchange wallets. This tool is key to unraveling selling trends amongst short-term and long-term holders.
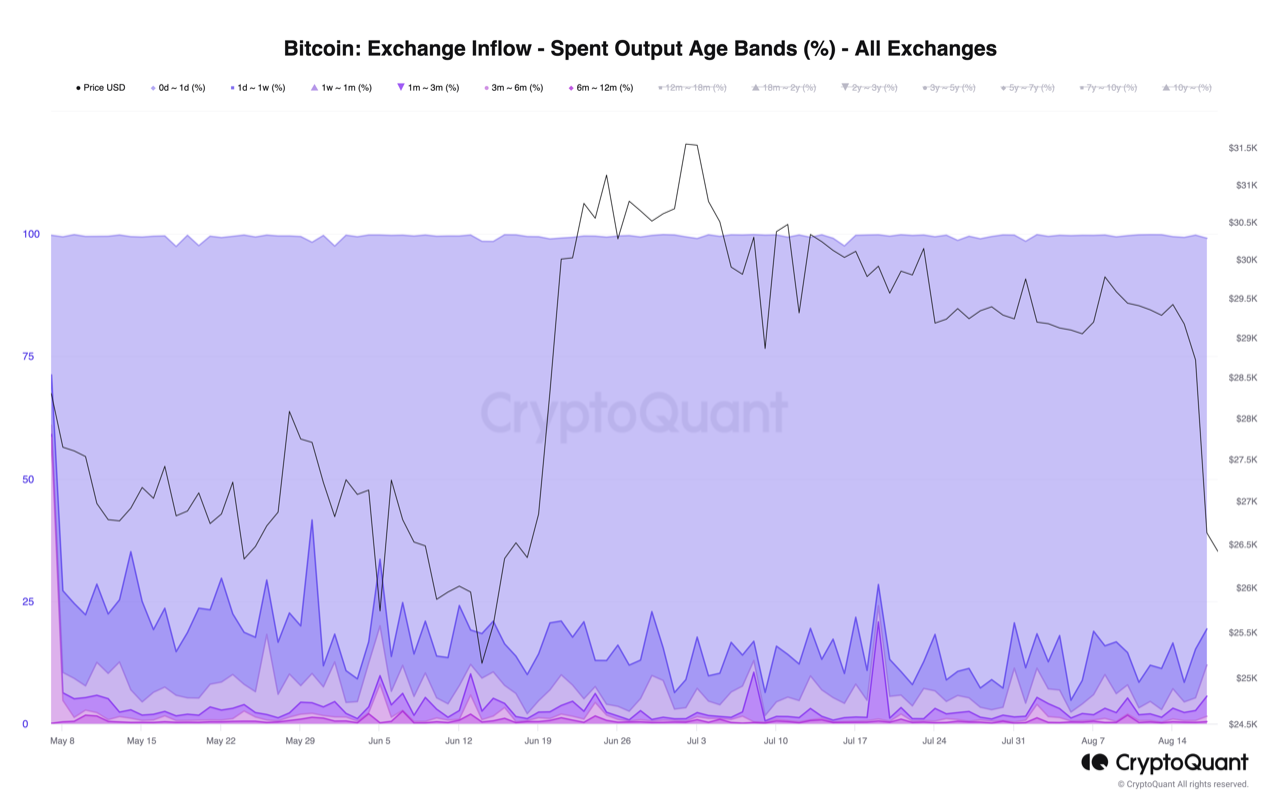
Source: CryptoQuant
Recently, the Bitcoin price descended below the realized price of short-term holders, triggering a notable sell-off. This selling activity predominantly emanated from those holding Bitcoin for relatively brief intervals, with the breakdown as follows:
- 79% of the sold Bitcoins – aged less than one day.
- 7% – aged from 1 day to one week.
- 6% – aged between 1 week and one month.
- 4% – aged between 1 month and three months.
- 1% – aged between 3 months and six months.
This data underscores that the recent sell-off primarily stemmed from short-term holders, as they accounted for a significant 97% of the Bitcoins transferred to exchanges for liquidation.
No Need To Panic!
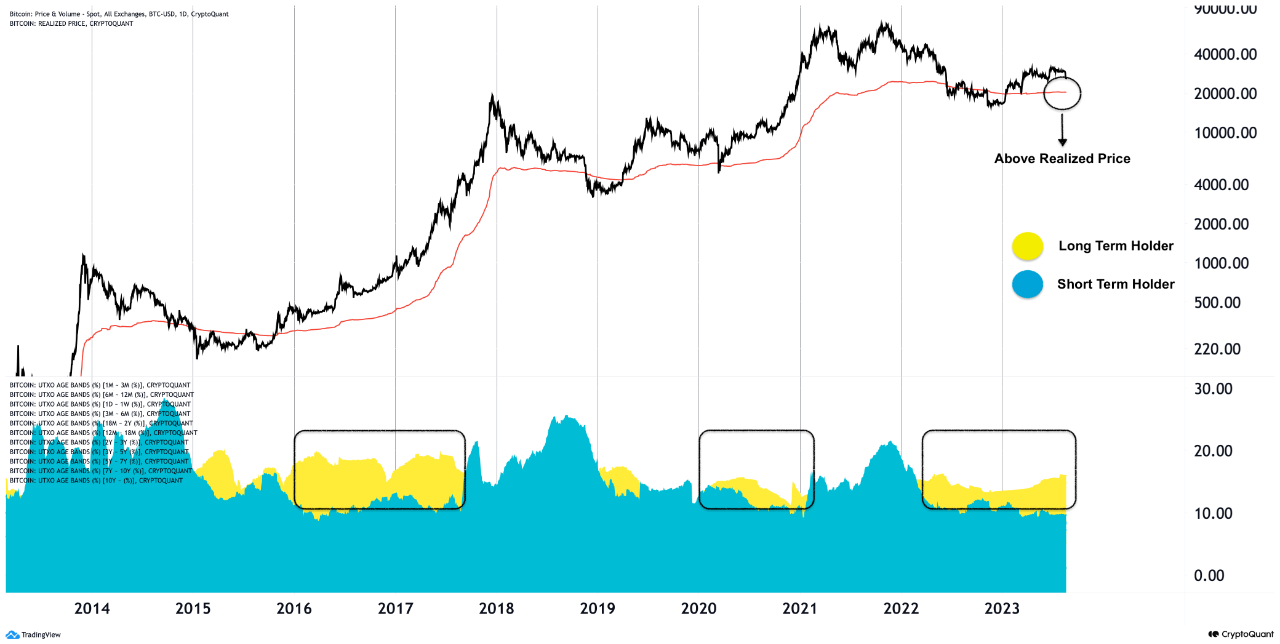
Source: CryptoQuant
Historical trends reveal a consistent pattern wherein, during phases of Bitcoin surpassing its “Realized Price,” “Long-term holders” tend to exert more influence than “Short-term holders,” leading to upward price movement.
Conversely, at the peak, “Short-term holders” dominate. This ongoing pattern implies that a gradual shift toward “long-term holders” will likely steer the market, propelling prices upward. Therefore, there’s no need for undue concern regarding the recent price dip.
Such occurrences are not uncommon during robust bull markets. The intricate dance between short-term and long-term holders is a hallmark of the market’s cyclical behavior.
⬆️ For more cryptocurrency news, check out the Altcoin Buzz YouTube channel.
⬆️ Our popular Altcoin Buzz Access group generates tons of alpha for our subscribers. And for a limited time, it’s Free. Click the link and join the conversation today.
Disclaimer
The information discussed by Altcoin Buzz is not financial advice. This is for educational, entertainment, and informational purposes only. Any information or strategies are thoughts and opinions relevant to the accepted levels of risk tolerance of the writer/reviewers and their risk tolerance may be different than yours. We are not responsible for any losses that you may incur as a result of any investments directly or indirectly related to the information provided. Bitcoin and other cryptocurrencies are high-risk investments so please do your due diligence. Copyright Altcoin Buzz Pte Ltd.


