With DeFi showing no signs of stopping, it is only natural that investors and traders are looking for which DeFi coin is primed for the next big move. Kyber Network (KNC) ranks in 10th place for all DeFi coins at the time of press and is one of the few top DeFi cryptocurrencies that hasn’t pumped significantly in the past week.
Kyber Network is one of the several decentralized exchanges otherwise known as DEX’s which have surfaced over the past couple of years in the crypto sphere. Right now there are some convincing technical signs that the Kyber Network price is about to rally.
Kyber Network Above Major Price Resistance Zone
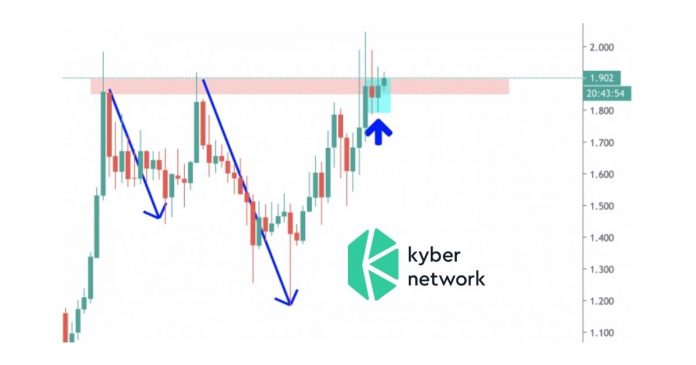
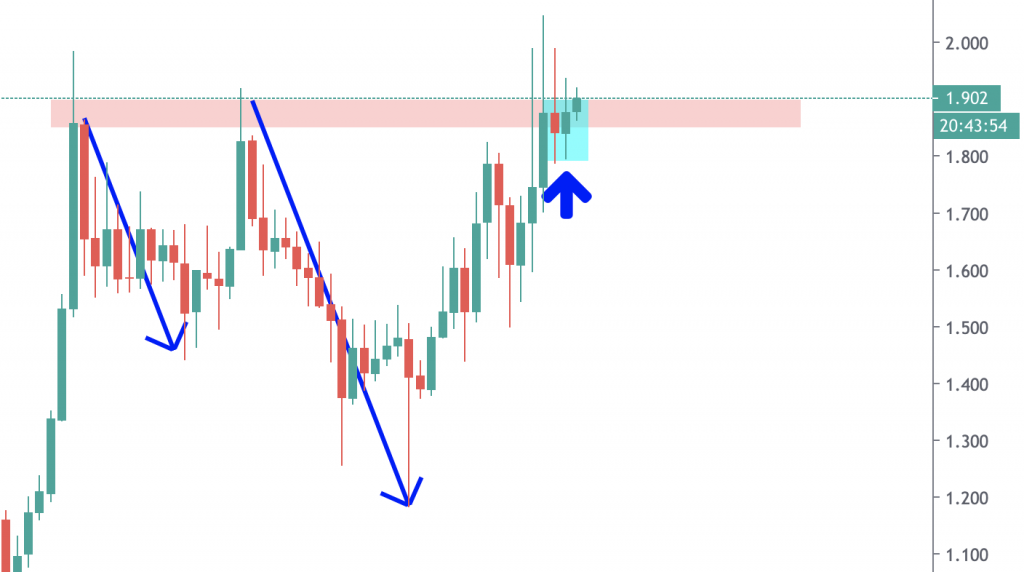
As you can see from the chart below, Kyber Network (KNC) has faced significant resistance in the $1.85-$1.9 zone. The resistance zone is marked by the red box and the price rejections are marked by the blue arrows pointing downwards. This red price resistance zone has been tested three times over the past three months but failed every time. At the time of press, we are directly above this zone at the $1.9 level.
Every time a resistance zone gets tested, sellers get worn out. Sellers who sold before at this level are not able to sell again or not able to sell as much again, simply because they don’t have as much KNC to sell due to having sold before. Therefore, the more times we test this level, the more likely we are to break it to the upside.
The first two times this level was tested, the price corrected significantly. However, this third time that it was tested, starting on August 14, the Kyber Network price barely corrected but instead formed a consolidation pattern directly at and below this $1.85-$1.9 zone. This consolidation pattern is marked by the aqua blue box in the chart above. This is a sign that buyers are stepping in and trying to hold the price up above this zone.
Strong Volume Gives Credence to Price Action
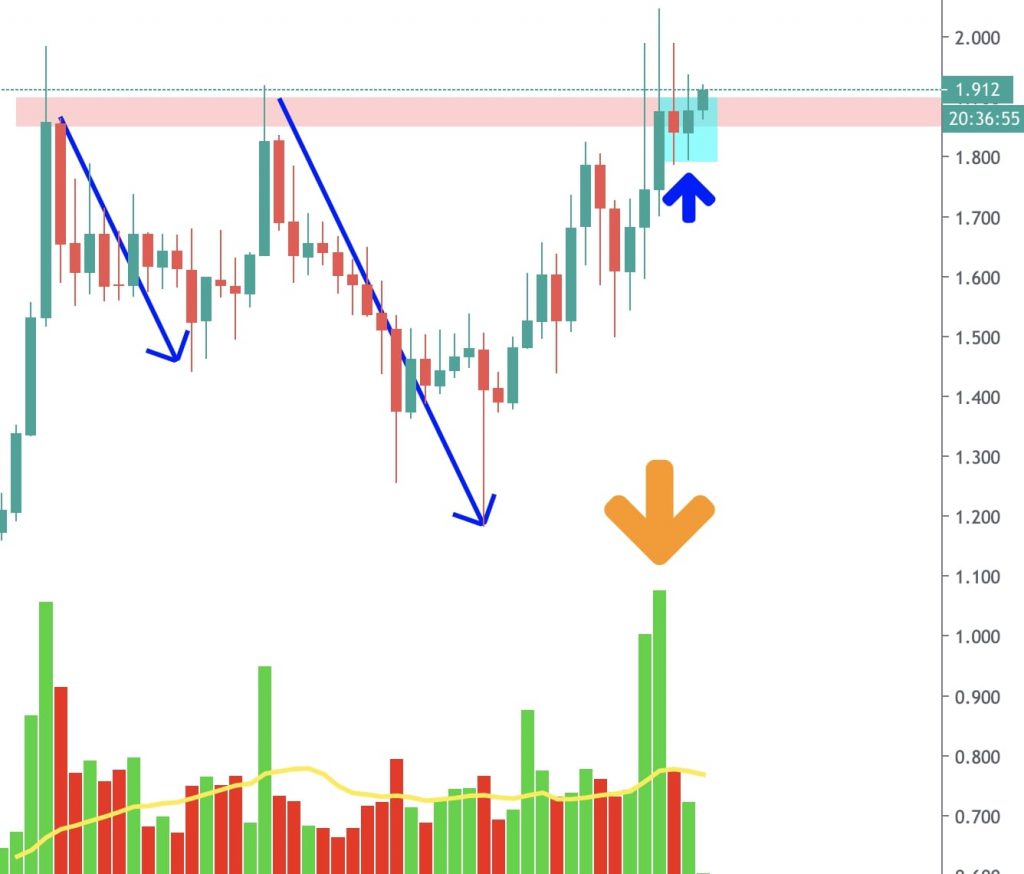
In addition, the KNC/USDT chart on Binance has displayed significant price volume over the past several days. This indicates that there are lots of buyers and sellers placing bets on which way the market will head next. Assuming that we hold above the $1.9 level, the buyers will come out of this battle victorious and create the momentum needed for the next big move up. This volume is represented by the large green columns in the image below, marked by the orange arrow.
Lower Time Frame Resistance Broken
When zooming down to the four-hour time frame on the Kyber Network price chart, one can see that we have formed important support at the $1.8 level. This is marked by the aqua blue line in the chart below. If a four-hour candle closes below this level, our Kyber Network price prediction of a new move up will be invalidated.
Not only have we established notable support at the $1.8 level, but we have also broken through the diagonal resistance line, marked in red in the chart above.
All of these signs suggest that KNC might be a good buy right now. Also, Kyber Network news regarding the Epoch 1 Voting going live was covered earlier this month.
Please note that the author has currently purchased KNC tokens, largely based on the above analysis.
—
Disclaimer
The information discussed by Altcoin Buzz is not financial advice. This is for educational and informational purposes only. Any information or strategies are thoughts and opinions relevant to accepted levels of risk tolerance of the writer/reviewers and their risk tolerance may be different than yours. We are not responsible for any losses that you may incur as a result of any investments directly or indirectly related to the information provided.
Do your own due diligence and rating before making any investments and consult your financial advisor. The researched information presented we believe to be correct and accurate however there is no guarantee or warranty as to the accuracy, timeliness, completeness. Bitcoin and other cryptocurrencies are high-risk investments so please do your due diligence. Copyright Altcoin Buzz Pte Ltd. All rights reserved.


