Investors and traders use divergences to try to determine if a market trend is weakening, which could result in a consolidation period or a trend reversal.
Divergence is a technical analysis pattern that can be seen on price charts when the price of a crypto asset is going against the trend of other data or in the opposite direction of a technical indicator. It is a signal that the trend may be weakening and shifting. It occurs when a price and an oscillating indicator, like the MACD or RSI, disagree.
Although it is not a strong enough signal to open a trade, it provides insight into the market’s condition. It indicates the possibility of an upcoming upward or downward price movement. Positive (bullish) divergence indicates a potential uptrend in price. Divergence that is negative or bearish suggests that prices may drop soon.
There are two types of divergence that may indicate the start of a bullish trend. The most typical sort of divergence is regular or classic. Though a little more tricky to notice, hidden divergence can be a powerful pattern that indicates a changing trend.
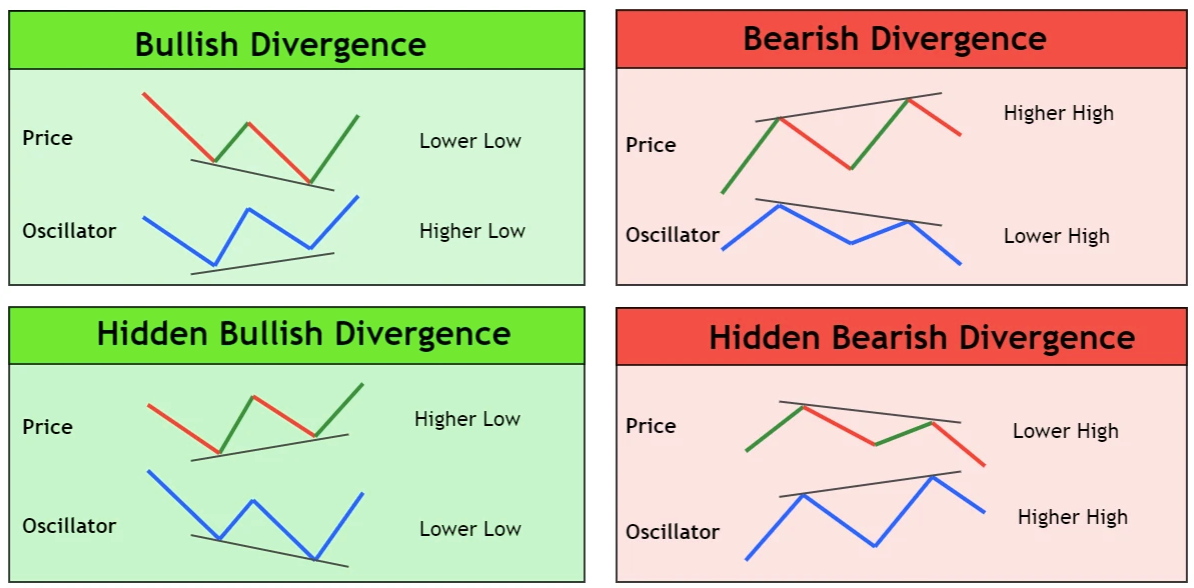
Regular divergence happens when a cryptocurrency’s price keeps dropping and makes lower lows while the indicator makes higher lows. Divergence, to put it more simply, is a pattern of conflict between price and indicator trend.
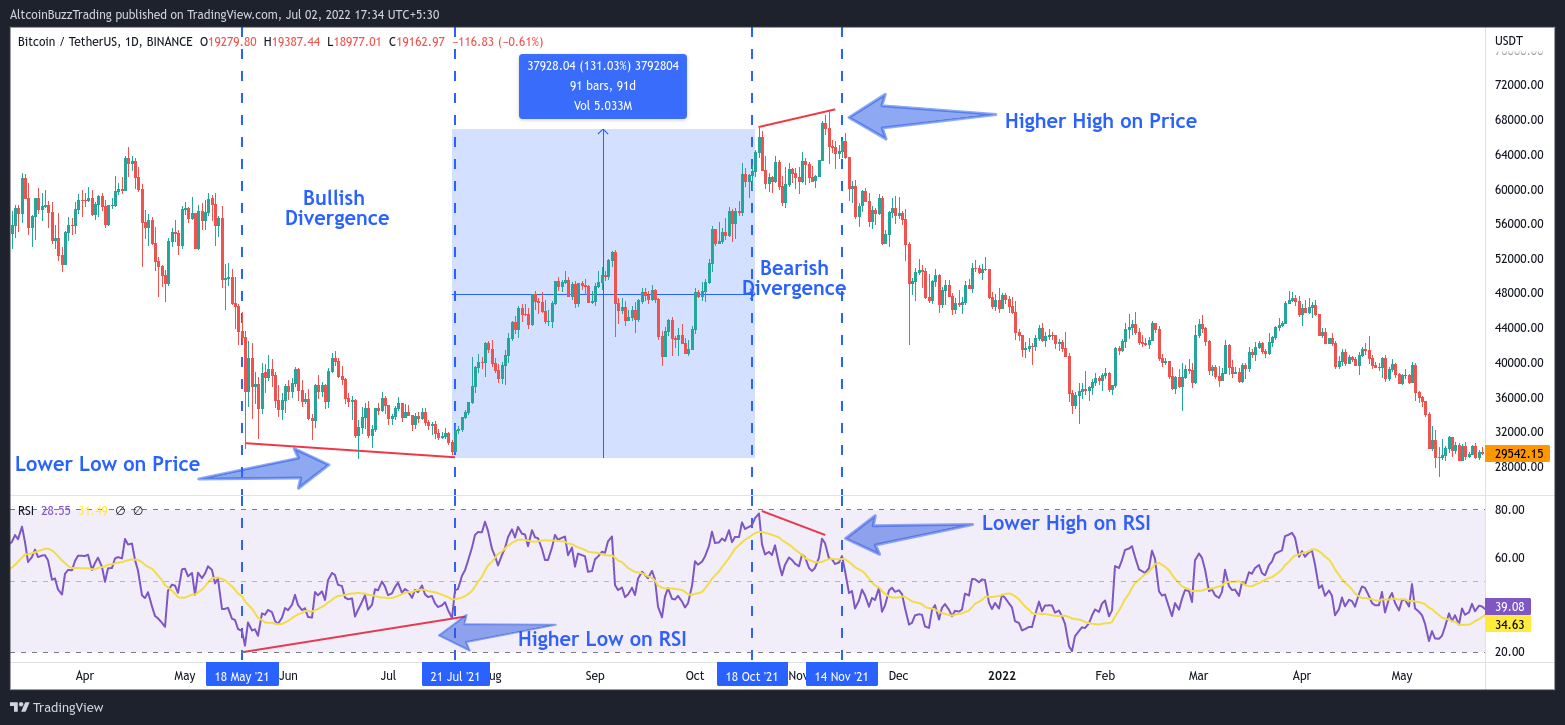
In the above example, Bitcoin’s price is in a decline and is consistently making lower lows. The RSI indicator, however, produces higher lows, indicating that the downward momentum has slowed and a bullish rally is likely to start. After that, Bitcoin increases in value by about 130 percent over the next few weeks or months.
In the other direction, the same thing is also possible.
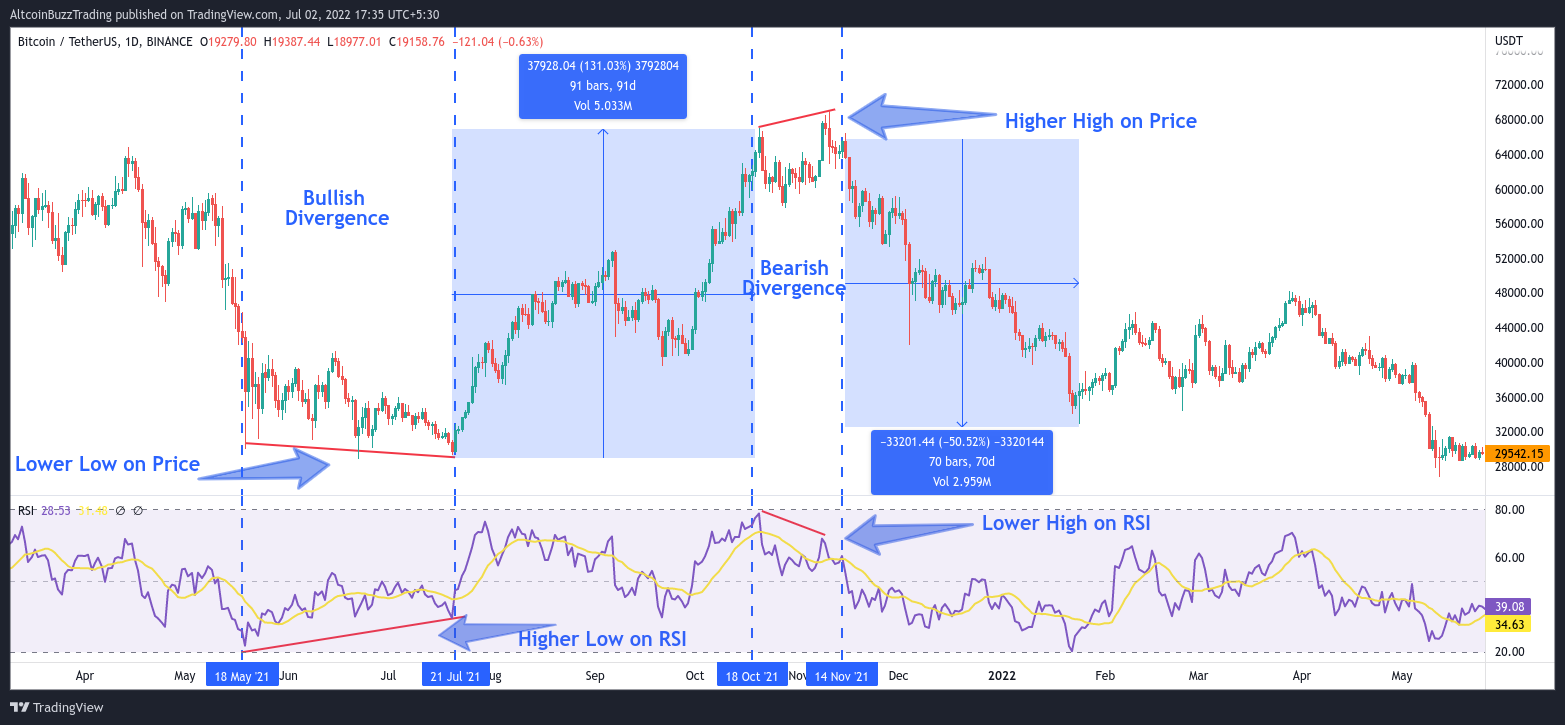
As seen in the image above, the price of Bitcoin keeps rising to new higher highs. A sequence of lower highs can be seen on the Relative Strength Index (RSI) indicator, though. This is a warning sign of market momentum that a downward trend is likely to start. After that, over the following few weeks or months, Bitcoin’s value drops by roughly 50%.
When a cryptocurrency’s price forms a higher low than the indicator does, hidden divergence occurs. A hidden divergence is often categorized as bullish or bearish depending on its direction, similar to a regular divergence.
A bullish hidden divergence occurs during an uptrend correction when the value of an asset makes a higher low. However, the indicator continues to show a lower low.
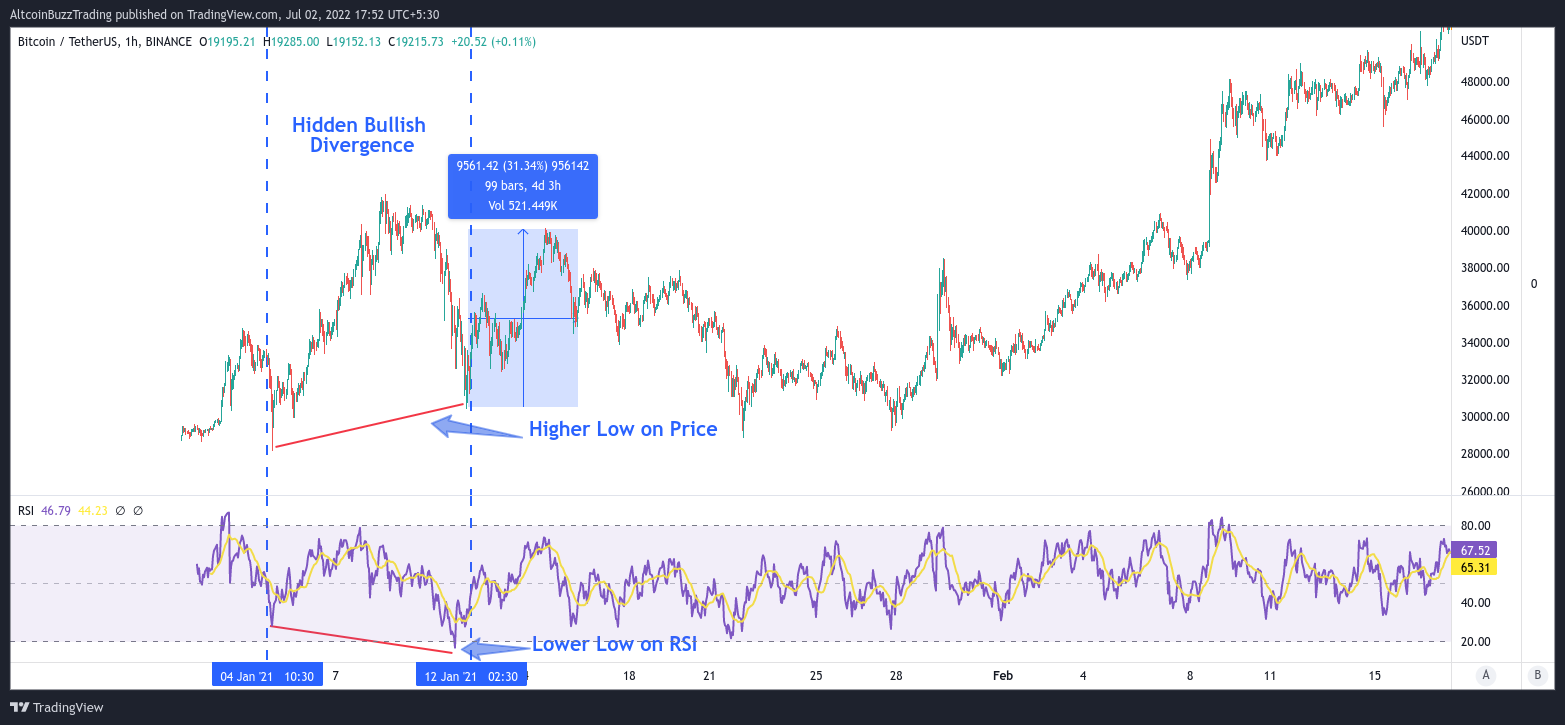
Bitcoin is forming a higher low in the above chart as it grinds sideways after stabilizing. A lower low is indicated by the RSI indicator at the same time. This hidden divergence is bullish. This implies the start of a rally. Over the following few days, BTC rose by around 30%, as expected.
On the other hand, a deeper correction may be indicated by hidden bearish divergence.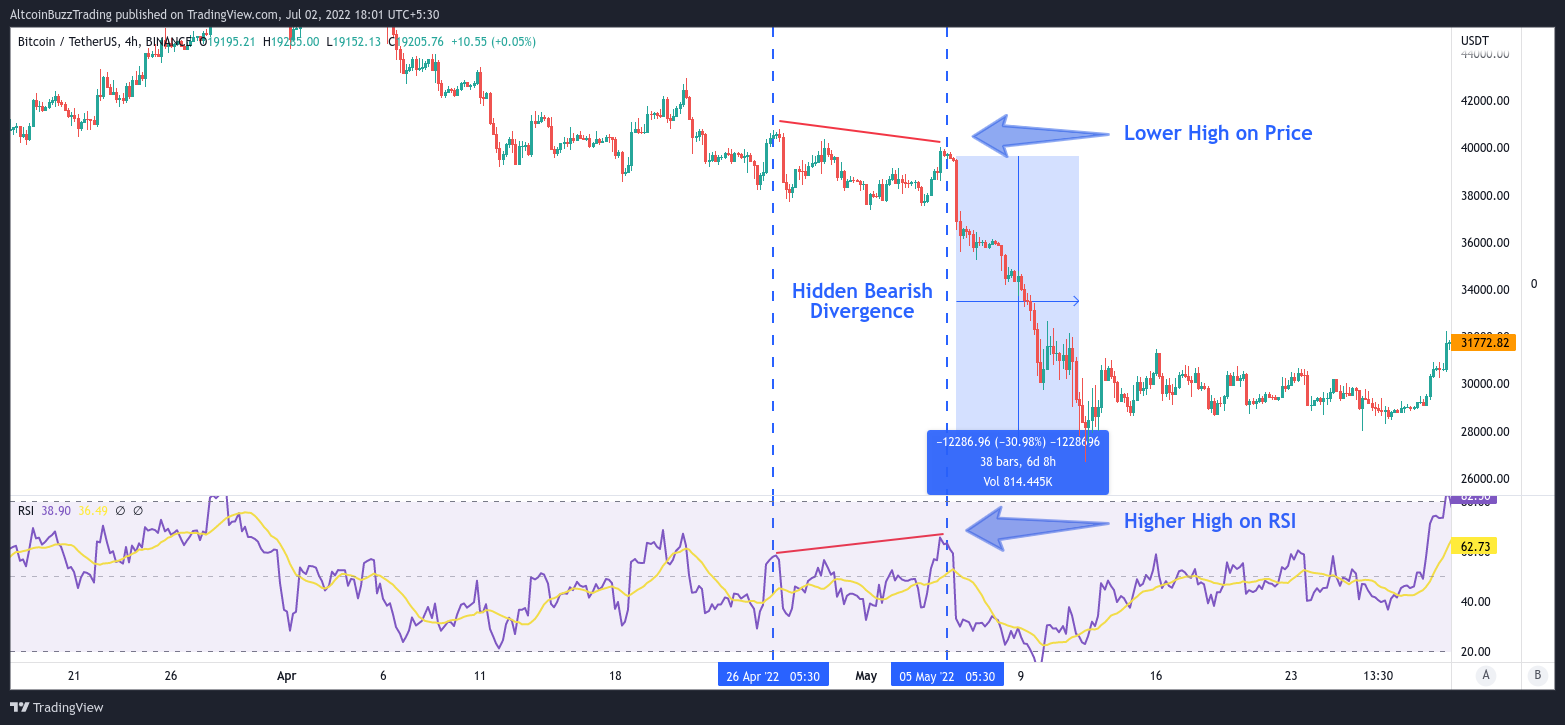
A hidden bearish divergence pattern is visible in the Bitcoin chart in the above image. While the RSI indicator shows a higher high, BTC’s price shows a lower high. The downtrend may soon resume as a result of this signal. Bitcoin quickly dropped another 30% or more.
Regular divergence usually occurs towards the end of a long trend and denotes the beginning of a new corrective phase. Usually discovered at the completion of a consolidation phase, hidden divergence indicates that the consolidation is about to end in support of the direction of the initial trend.
Due to the positioning of the pattern, hidden divergence differs from the regular ones. Hidden divergence frequently happens within an existing trend. It denotes the end of the larger trend’s consolidation phase. Because it isn’t obvious to the untrained eye, we refer to it as being “hidden.”
Powerful patterns known as bullish and bearish hidden divergences are visible at the completion of consolidation. They indicate that the initial trend will continue. These patterns are simple to learn because they are commonly observed in the markets for Bitcoin, Ethereum, and other cryptocurrencies.
It can be difficult to find them in real time, though. In addition, the trade generally produces lower returns if hidden divergence is discovered late in the trend. Selecting your trades in the direction of the flow trend is the secret to trading hidden divergence successfully. Always assess market sentiment, and the ideal momentum indicator to confirm the signals is one that follows trends.
And for our best, freshest research on NFT buys, Layer 1 chains, DeFi, or games, come check out Altcoin Buzz Access. Plans start at only $99 per month
For more information on cryptocurrency, visit the Altcoin Buzz YouTube channel.
Images courtesy of TradingView.
Disclaimer
The information discussed by Altcoin Buzz is not financial advice. This is for educational and informational purposes only. Any information or strategies are thoughts and opinions relevant to accepted levels of risk tolerance of the writer/reviewers and their risk tolerance may be different than yours. We are not responsible for any losses that you may incur as a result of any investments directly or indirectly related to the information provided.
Do your own due diligence and rating before making any investments and consult your financial advisor. The researched information presented we believe to be correct and accurate however there is no guarantee or warranty as to the accuracy, timeliness, completeness. Bitcoin and other cryptocurrencies are high-risk investments so please do your due diligence. Copyright Altcoin Buzz Pte Ltd. All rights reserved.

Casper Network is betting big on EVM support, AI payments, and quantum-safe blockchain infrastructure with its new multi-year roadmap.

Microsoft's bet on Space and Time is starting to pay off with the launch of Dreamspace, a no code app builder

Worldcoin's World ID is now live and updated. It's out to prove you are human when on the web instead of dealing with a bot.